


Company expense breakdown pie chart




Try Before you Buy Download Free Sample Product
 Impress Your
 Audience
 100%
100% Editable
 Save Hours
 of Time


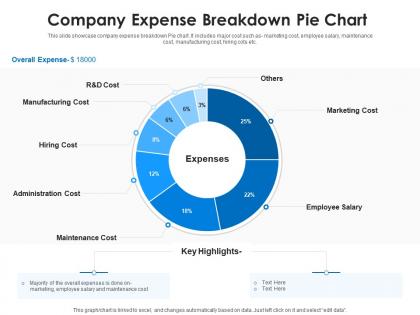
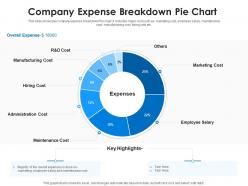
This slide showcase company expense breakdown Pie chart. It includes major cost such as- marketing cost, employee salary, maintenance cost, manufacturing cost, hiring cots etc.
People who downloaded this PowerPoint presentation also viewed the following :
Company expense breakdown pie chart with all 2 slides:
Use our Company Expense Breakdown Pie Chart to effectively help you save your valuable time. They are readymade to fit into any presentation structure.
FAQs for Company expense
So basically you want to hit five main things when digging into expenses. First, make sure everything's categorized properly - sounds tedious but trust me, you can't spot patterns in a mess. Track your month-to-month and yearly trends next. Compare what you actually spent vs your budget to find the big gaps. Calculate per-unit costs whenever you can (way better for comparing). And definitely flag anything that looks totally off - could be mistakes or maybe opportunities you're missing. Oh, and start with your biggest expense buckets first since that's where you'll actually move the needle.
Honestly, sorting your expenses is a game changer. You'll actually see where your cash disappears - like wait, did I really spend $200 on coffee this month? Makes it super easy to spot the stuff that's draining your budget vs what's actually worth it. Setting budgets becomes way more realistic too since you're working with real numbers, not just guessing. And when you need to tighten up spending (which we all do sometimes), you won't be randomly cutting things. You'll know exactly which categories are bloated and need trimming first.
Honestly depends on how big your company is. Excel or Google Sheets are perfect for basic stuff - you can make dashboards and pivot tables pretty easily. QuickBooks and Xero work well for smaller businesses since they handle both accounting and expense tracking. Big companies usually need something like SAP or Oracle for the heavy lifting. I've actually seen people work magic with just Excel though! Tableau's good too if you're into fancy analytics. The real trick is finding something your team will stick with - doesn't matter how powerful it is if nobody uses it. Start basic and upgrade later.
Check your expenses monthly for sure - catches weird charges before they spiral. We got hit with a duplicate software charge for THREE months because I wasn't paying attention lol. Then do a deeper dive quarterly to spot trends and see where you can actually cut costs. Honestly, quarterly reviews are where the real magic happens with budget comparisons. Weekly might be overkill unless you're seasonal or things are crazy right now. Just set a calendar reminder for 30 minutes monthly. Focus on your biggest expense categories first - that's where the money bleeds fastest anyway.
Don't rush into it without organizing your expense categories first - that's where most people mess up. Look at 3-6 month patterns instead of just one weird month. Small recurring stuff adds up way more than you'd think, so don't only focus on the obvious big expenses. Context matters too - a $10k expense could be totally fine if it brought in $50k. I learned this the hard way lol. Most importantly, you can't analyze expenses without looking at what revenue they generated. Start with cleaning up categories, then spot the actual trends.
Looking at your old expense data is honestly a game-changer for budgeting. Pull reports from the last 2-3 years and organize them the same way so you can actually compare stuff. You'll start noticing patterns - like how marketing always goes crazy in Q4 or which departments never hit their limits. Seasonal spikes become super obvious too. Way better than just throwing numbers at the wall and hoping they stick! The tricky part is making sure everything's categorized consistently, but once you do that, trends jump out at you.
Think of expense analysis like being a detective with your own money. Pull up your last 6 months of spending and start grouping everything by category. You'll spot patterns pretty quickly - trust me, some will shock you. Compare what you actually spent versus what you budgeted, then hunt for the weird outliers. Those "wait, I spent THAT much on coffee?" moments are goldmines. Focus on categories where you're bleeding the most cash first. It's actually kind of fun once you get into it, like solving a puzzle where the reward is keeping more of your paycheck.
Check out IBISWorld or BizStats for industry breakdowns - they show costs as percentages of revenue which is way more useful than raw numbers. Your trade association probably has this stuff too. The SBA publishes decent benchmarking data that's actually readable. Honestly though? Grab coffee with other business owners in your space. That's where you get the real dirt on what's actually normal vs what looks good on paper. Focus on your biggest expense categories first - like cost of goods, labor, overhead. Don't try benchmarking everything at once or you'll go crazy. Start with your top 3-5 and work from there.
Honestly, I'd probably start with a basic pie chart to see where your money's actually going by category. Bar charts are solid too if you want to compare different months or departments side by side. But line graphs? Those are clutch for spotting trends over time - like, you'll actually see if things are getting worse or better. Heat maps are kinda cool for finding weird patterns, especially when you've got tons of data. Start simple with the pie or bar chart first. Then dig into line graphs to catch any red flags or maybe find some places to cut costs.
Looking at your spending history is honestly the best way to figure out where your money's actually going. Pull the last 12 months of data and sort everything into categories - sounds boring but it's worth it. You'll start seeing patterns that help you budget for next quarter. Fixed vs variable costs matter too since they tell different stories about your business. The cool part? You can spot inefficiencies that might mess with your bigger goals down the road. Breaking it down by department or time period shows what's really driving costs up or down.
So fixed expenses are like your rent, insurance, salaries - stuff that stays the same no matter what. Variable ones change based on how much you're selling or producing, like materials and shipping costs. The tricky part is finding the right balance between them. Fixed costs are your baseline - you're stuck paying them even if business sucks. But variables? You can adjust those pretty easily. I learned this the hard way when I had too many fixed costs early on. Really though, it depends on where you are in your business journey and what kind of model you're running.
Set up expense tracking that flags weird spending patterns or anything over your limits. Most systems have approval workflows - stuff goes to you first before getting reimbursed. Honestly, clear policies upfront solve like 80% of problems. People aren't trying to waste money, they just don't know the rules. Monthly reports help you catch trends early. Oh, and definitely look back at last quarter's spending first - you need to know what "normal" looks like before you can spot the outliers. Then just talk to people directly when something seems off.
Dude, don't mess around with expense policies - it'll come back to haunt you. They'll reject your reimbursements and you're stuck paying for work stuff yourself. HR starts watching you if it becomes a habit, which is awkward as hell. The tax stuff gets messy too since bad documentation screws with deductions. Oh, and if you slip personal expenses in there? That's straight-up fraud and they can fire you for it. I learned this the hard way when my coworker got called out. Just keep your receipts organized and follow their rules - it's so much easier.
Look, you can't figure out if something's actually profitable without knowing what you spent on it - otherwise you're just throwing darts blindfolded. Track everything: labor, materials, overhead costs, all of it. Then you can actually compare what you put in versus what you got back. Plus it helps you catch budget problems before they spiral (learned that one the hard way). The key is being consistent with how you categorize expenses across different projects. That way when you're deciding on future stuff, you can see which types of projects actually made money and which ones were basically money pits.
So there's a bunch of stuff you should keep an eye on. Your expense-to-revenue ratio is huge - shows how much you're burning vs making. I'd also watch spending variance against your budget, how long approvals take, and whether people actually follow your policies (spoiler: they probably don't). Processing costs matter too since doing everything manually gets pricey real quick. Monthly trends by category catch problems early. Honestly, the game-changer is setting up alerts when things go sideways - way better than finding out you're over budget at month-end when it's too late to fix anything.
-
Appreciate the research and its presentable format.
-
Innovative and Colorful designs.
-
Unique research projects to present in meeting.
-
It saves your time and decrease your efforts in half.