

 0 Comment
 Customer Reviews

Think about the last dashboard you were shown at work. Was it elegant and fundamental and made sense immediately? Or was it a jumble of graphs and numbers and colours and left you with more questions than answers? If it's the latter - you are not alone.
No matter how much "lean thinking" is talked about, most companies still struggle when it comes to the execution of visualising performance. Lean Dashboards help teams focus on the things that matter, so they can act faster! But most dashboards are bloated, confusing and aren't lean whatsoever.
Check out our blog on Top 10 Monitoring Dashboard Templates to monitor your digital marketing channels and the success of your company.
Why? Because building a lean dashboard is easier said than done. Teams face ambiguity over goals, sources of data are often disjointed, software is often awkward, and let's face it, there are usually too many voices in the meeting room. You know what you want — clear, actionable, no-frills reporting — but getting there is a different story.
Welcome to SlideTeam’s, “Top 10 Lean Dashboard Templates”. Our frameworks eliminate the guesswork out of lean reporting. It doesn't matter whether you are a startup founder, project manager, or advanced operational lead our templates will help you visualize what you want, the right metrics, the right way — Zero hassle.
What's inside? You get everything from business intelligence, process optimization, dashboard software to more.
Our templates are totally customizable, extremely content-friendly, and can easily download in png and jpg/jpg formats!
No more waits. Get access to slides that simplify reporting, sharpen performance tracking, and actually support lean thinking the way it was meant to be. Just scroll down to find out what’s included in each template and prepare yourself to add clarity, pace and intention to your reporting.
Visit our blog on Top 7 Integrated Dashboard Templates to manage the complexities of logistics management, or ensure success of the latest project.
Template 1: Lean Implementation Framework Digital Lean Implementation Initiatives PPT Template
This presentation slide provides KPIs to incorporate employee action status, improvement action steps, sickness statistics, green cross and target results, and other indicators planned. This dashboard allows teams to compare the impact of lean approaches to the overall goals of the business, helping keep everything in sync. It allows for not just performance tracking, but also promotes continuous improvement throughout departments. Download it now.

Template 2: Lean Manufacturing Dashboard Showcasing Production Progress Implementing Lean Production PPT Template
This PPT Theme displays a real-time view of key manufacturing KPIs covering production volume, orders volume, causes for down time, returned products by reason and relevant performance metrics. It allows teams to monitor production output, and identify where bottlenecks and quality issues are with agility. By providing managers with data that allows them to make decisions quickly and better execute on top of lean strategies. Get it now.

Template 3: Lean Kaizen Manufacturing Dashboard to Check Production System Efficiency PPT Template
This PowerPoint Slide offers a detailed KPI dashboard in alignment with key metrics like TEEP, OEE, loading time, production quality and hours and type losses. It provides teams to analyse how efficient an operation is, identify unproductive areas and take corrective actions. It helps in ensuring kaizen efforts and lean initiatives are working, thus reducing any waste and human errors; contributing to better production. Download it now.

Template 4: Lean Stock Management Dashboard to Eliminate Wastage PPT Template
This presentation theme covers important inventory KPIs to engage in lean inventory practices. It includes important lean metrics such as the number of monthly batches picked up and stock request data segmented for clarity. The dashboard enables the team to track the stock movement, recognize the slow-moving items, and correlate the replenishments against the actual demand. It helps in better cash flow. Get it now.

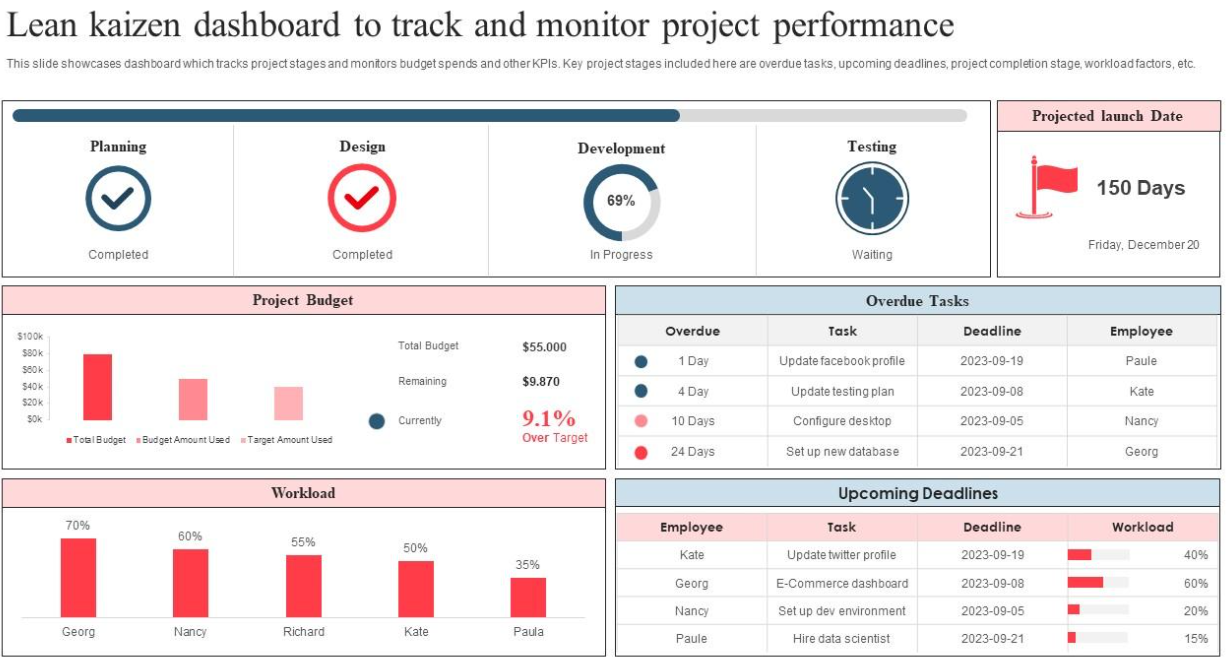
Template 5: Lean Kaizen Dashboard to Track And Monitor Project Performance PPT Template
This PPT Theme to monitor the initiatives in a structured way under define, measure, destroy, act or control. The data-driven approach is common for quality improvement and problem-solving. It presents a broad overview of how each DMAIC phase helps in process improvement starting from problem identification to controlling results. Enables managers to track the health of the project, and gain real-time analytics into progress. Get it now.
Template 6: Dashboard For Lean Product Management PPT Template
This presentation slide illustrates key metrics like total profits and cumulative profit per product, providing an overview of the contribution of individual products to the overall success of the business, at a glance. Product lean management dashboard use this dashboard to understand the trends in product performance, identify products needing attention and also help them allocate resources rapidly adding efficiency to the process. Get it now.

Template 7: Industry Analysis Of Lean Implementation with KPI Dashboard
This PowerPoint Framework covers key performance indicators for performance areas such as company size, lean maturity and how it was implemented. This dashboard visualizes the period over which organizations have been practicing lean principles, segmented by size and type of industry. It allows decision-makers to use a benchmark to assess their own level of progress against peers while also pointing to gaps in execution. Get it now.

Template 8: Management Status Dashboard Hoshin Kanri Deck PPT Template
This PPT Theme covers lean value stream mapping across critical aspects of the business. It covers important KPIs of availability, performance, quality, OEE, and AMO. Each metric is linked to certain processes, and it ensures teams track how well they are doing against the strategic goals. It enables Hoshin Kanri or management by policy to extend across the organization by aligning daily activities. Download it now.

Template 9: Hoshin Kanri Deck Production Process Dashboard PPT Template
This PPT Theme includes some key metrics such as lead generation, machine utilization, OEE, AMO in a few processes. Monitor production system performance metrics to track the efficiency of how production systems are operating, while showing areas that require additional focus/efforts. This agile dashboard provides insight into production flow and resource use, enabling improved planning, faster decision making, and ongoing process improvement. Download now.

Template 10: Hoshin Kanri Deck Visual Product Management Dashboard PPT Template
This presentation theme covers visual management summarizing the different phases of product management, tracking use cases and prioritization for the team. Its phases are all clearly defined, which allows the state of products to be visually determined within the scope of development and execution pipeline. The dashboard supports the alignment approach by visually linking activities of the team to the objectives of greater organization. Get it now.

Drive Operational Efficiency With Our Templates!
Today, everything is about clarity, speed, and continuous improvement — and that is where Lean dashboards work their magic. Lean six sigma dashboard templates are ideal for keeping teams aligned, informed, and focused on performance, whether you manage a manufacturing floor, service operations, or digital transformation for your organization.
Our dashboards provide real-time visibility which results in better decision-making to track cycle times and locations, data visualization waste, monitor KPIs such as OEE, first pass yield, process optimization or lead time.
Whether it be healthcare, logistics, automotive, software development, or retail, Lean dashboards are adaptable to any industry which makes them so flexible! Our frameworks connect strategy to execution, ensuring everyone is aligned and clear on goals they can see accomplished (or not).
Download our templates now and turn your lean reporting into a competitive edge.
PS: Don't forget our blog on Top 10 Product Dashboard Templates to help you make informed decisions and forecasts about your project.
Lean Dashboard Templates FAQs
1. How does a Lean dashboard support Lean management principles?
A Lean dashboard encourages real-time information on process, productivity, quality, and related KPIs. Its transparency and contextualization of performance data encourages ongoing improvement, as teams can rapidly identify deviations, easily assess progress against goals, and make data-driven decisions. This is in line with Lean, which places an emphasis on waste reduction, flow improvement, and maximizing value to the customer.
2. What are the key metrics typically displayed on a Lean dashboard?
Key metrics that you would find in a Lean dashboard are:
- Cycle Time
- Lead Time
- Work-in-Progress (WIP)
- First Pass Yield (FPY)
- Overall Equipment Effectiveness (OEE)
- Downtime or Delay Times
- Defect Rates
- Output per Shift
These key performance indicators enable teams to assess their performance, look for bottlenecks, and check if Lean has been practiced as intended.
3. How can a Lean dashboard help identify waste and inefficiencies?
Lean dashboard makes it clear where we need to focus our improvement efforts, and against which processes we have actual performance gaps; so the answer to our third question is that the Lean dashboard highlights waste areas (waiting, overproduction, rework) quickly. The dashboard contains visualizations of trends, such as an increase in defect rate or lengthy cycle times, that enable teams to identify the root causes of inefficiencies, as well as determine which improvement actions to make a high priority. It helps to fix the problems in less time to promote continuous improvement.