The American Psychological Association has published a study showing that the more frequently you check in on your progress toward a goal, the more likely it is that you will succeed. Between setting and achieving a goal, it is essential to track its progress to make sure that the intended actions are taken.
Keeping track of the variables that influence goal achievement and failure is a time-consuming, difficult job that cannot be done manually. This is why monitoring dashboards are created. A monitoring dashboard combines your data sources into a single, highly optimized layout, enabling you to monitor your digital marketing channels and the success of your company.
Here is how we can encapsulate the significance of dashboards in a single sentence: Creating a single source of truth to decrease the number of human errors and time spent preparing reports.
Why Are Monitoring Dashboards Beneficial?
Monitoring dashboards help you collate all your crucial company metrics in one place. When done correctly, it also becomes your organization's exclusive source of facts. The use of these dashboards results in a number of benefits. Among the most significant advantages are:
- Customizable– Dynamic dashboards are adaptable to users' needs and expectations. The most valuable and practical set of information can be presented on each decision level dashboard by customizing it. Each employee can now see the degree of detail to which they must do their tasks and achieve their objectives.
- All-in-one- Before making a decision, users often spend a lot of time evaluating and analyzing reports. Monitoring dashboards make it possible to see a quick overview of the needed information's status.
- Drill Down- Having everything at once does not preclude specifics, though. Dashboards are designed with the flexibility to drill down into the information as deeply as needed by just choosing the desired variable or object.
- User Responsive Presentation- There is no requirement for difficult and time-consuming training. Any user may easily understand how a dashboard works.
- Decision Making is improved- Making your company more effective and responsive to opportunities and problems is a huge potential offered by the dashboard. It does so by examining facts and monitoring the state of operations. There's no need to ask developers for data, wait for the report, and then try to act on it. The free flow of information between important parties is instead made possible by dashboard reports.
We've highlighted SlideTeam's most well-liked monitoring dashboards below. These are editable and 100% customizable. The learning curve for using these dashboards is not steep. These highly optimized dashboards will safely and automatically connect users to the data they require, either in real-time or as near to real-time as feasible.
Here are the top 10 monitoring dashboards that SlideTeam has curated for your exclusive use.
Template 1: Consulting Project Status Monitoring Dashboard
This dashboard for tracking project progress gives you an insight into how effectively you used your budget. It enables the leader to monitor the performance of delivery teams in ongoing projects. This project status dashboard template uses straightforward indicators to offer managers a quick overview of the state of their projects. The majority will find this admin template to be appealing because of its clutter-free design. . Before making any adjustments, you can also pick between predetermined color skins and dashboard designs.
Template 2: Vendor Compliance Monitoring Dashboard Procurement Cycle Time PPT Deck
Vendor managers can use this PPT deck to address subjects including the rate of contract compliance by supplier category, the length of the procurement cycle, and the top suppliers according to partner status. This PowerPoint Presentation has been created with a professional yet creative approach in mind.
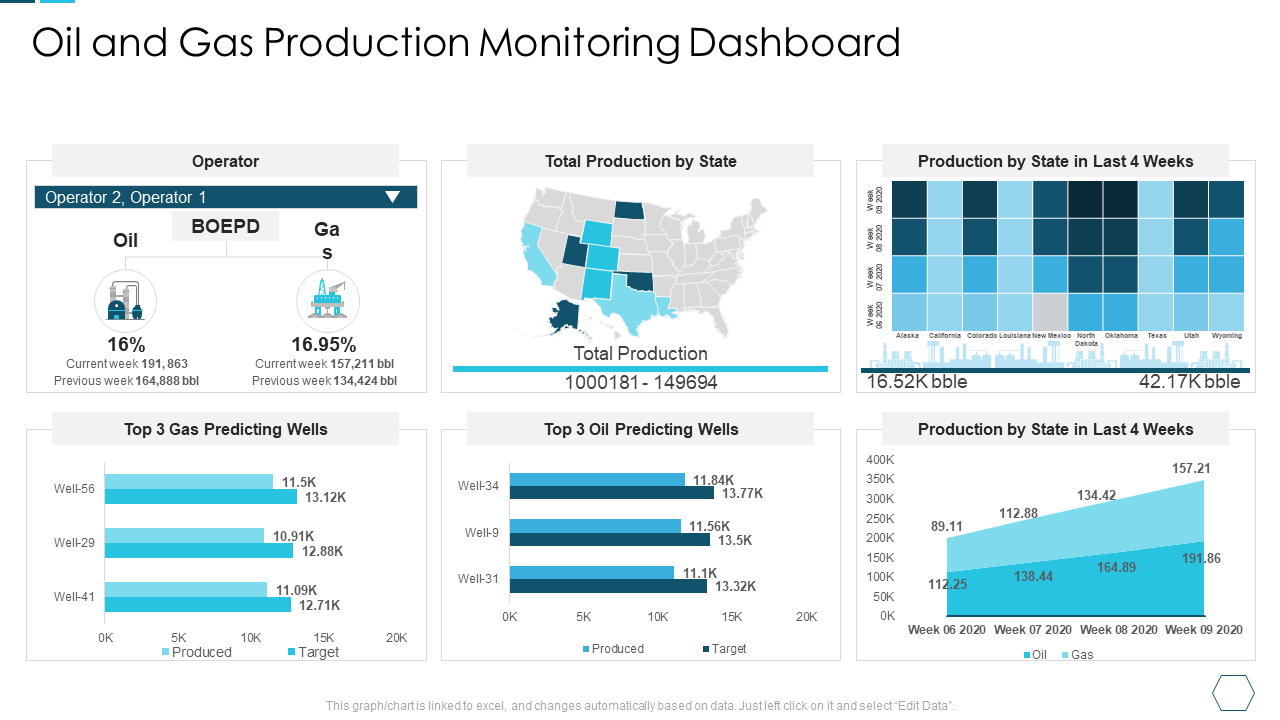
Template 3: Oil and Gas Production Monitoring Dashboard Analyzing the Challenge High
If you operate in the oil and gas sector, you must keep track of a lot of data, including production figures, well downtime, production expenses, and many other things. You can monitor all KPIs your team relies on with the user-friendly, adaptable oil and gas monitoring dashboard from SlideTeam.
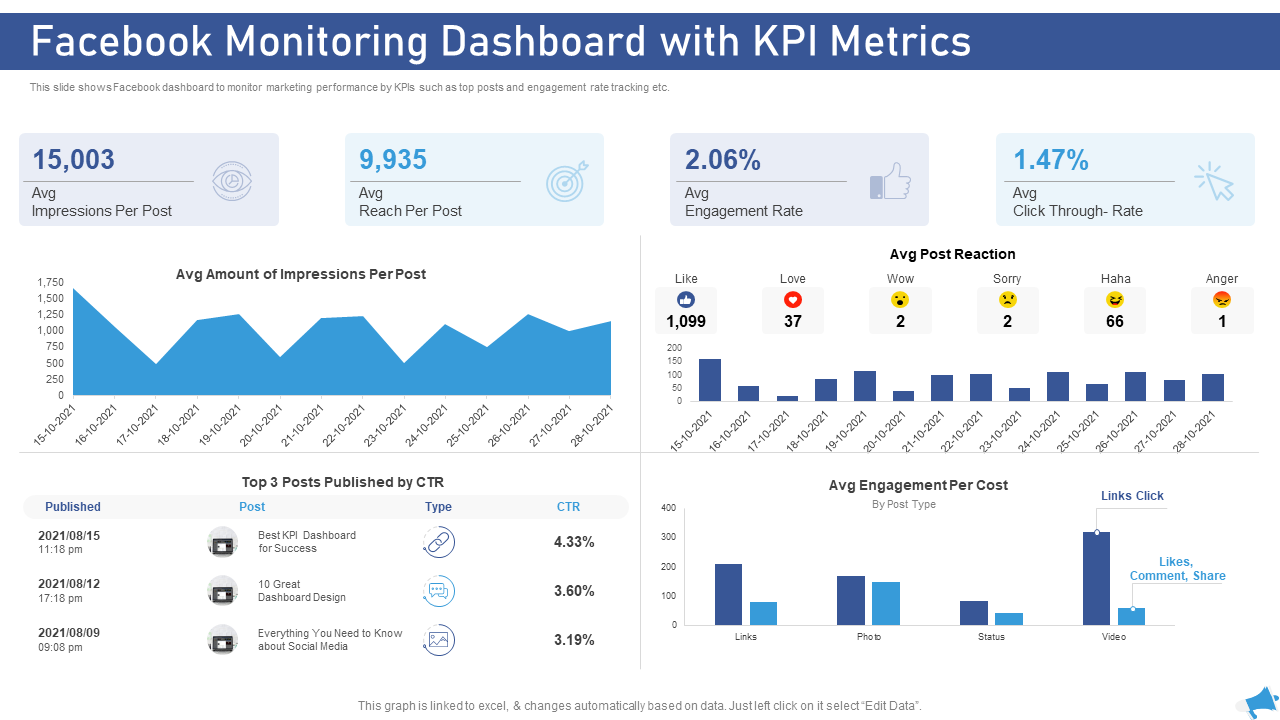
Template 4: Facebook Monitoring Dashboard with KPI Metrics Digital Marketing through Facebook PPT Rules
Discover important facts about your Facebook page by using this Facebook (Page Insights) Dashboard Template. Use this effective visual tool to keep track of crucial metrics like page visits, clicks on the page, the total number of likes, demographic and follower data, and so on.
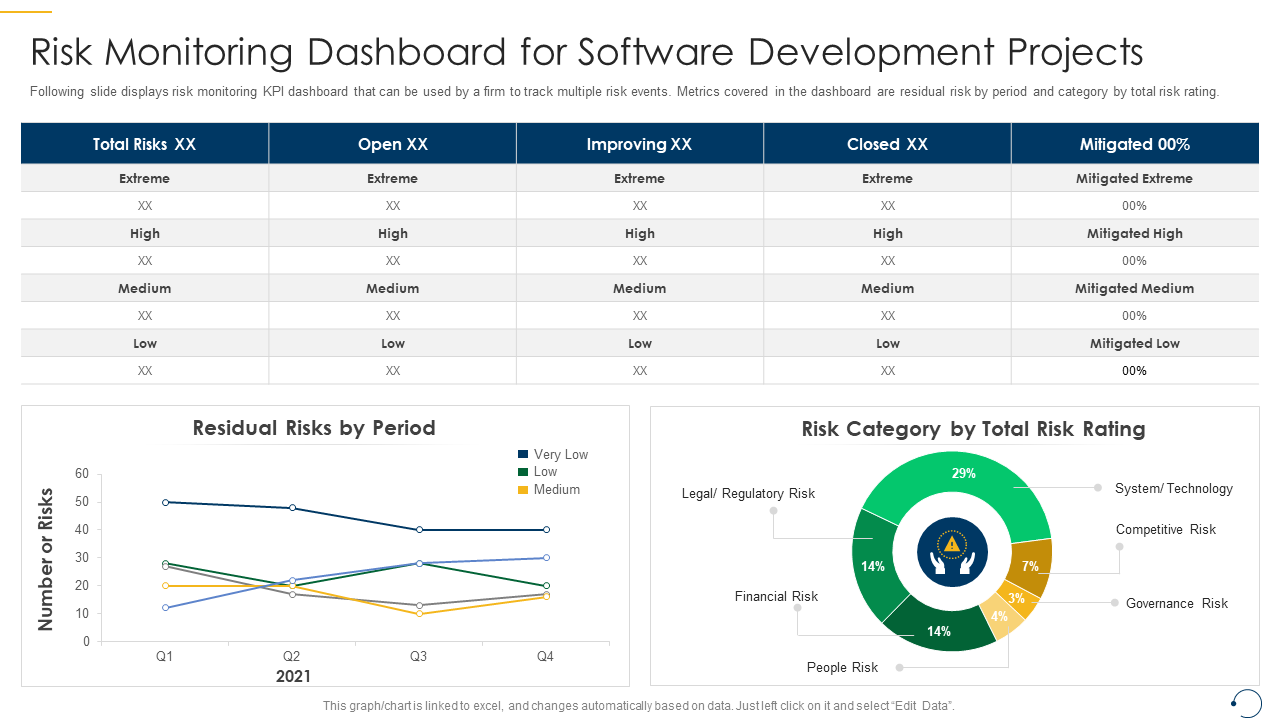
Template 5: Risk Monitoring Dashboard for Software Development Projects PSM Training IT
Lack of risk management processes or poor use of those that exist are the main factors in software project failure. To track these risk measures, our team has created a risk monitoring KPI dashboard. This risk monitoring dashboard template can be used to talk about risks to finances, people, governance, competition, systems, or technology.
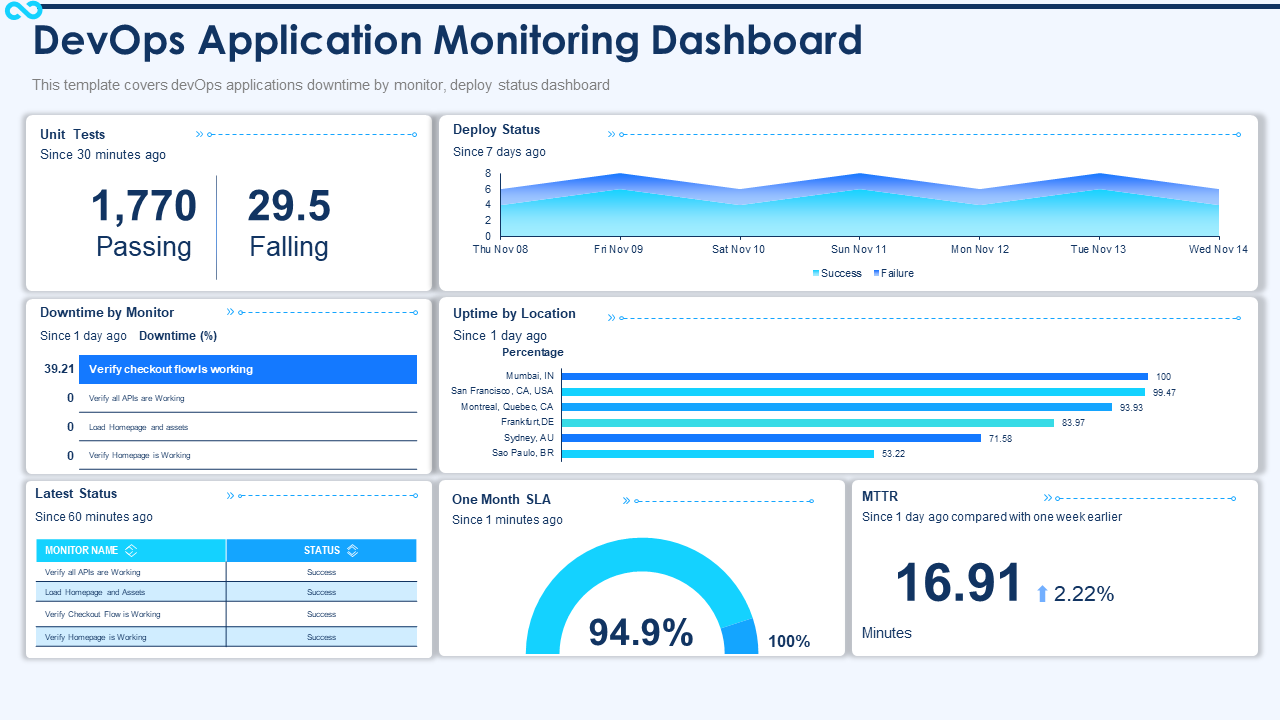
Template 6: DevOps Dashboard IT Devops Application Monitoring Dashboard PPT PowerPoint Designs
For measuring development activity and identifying areas for ongoing improvement, SlideTeam provides ready-to-use DevOps monitoring dashboard templates. By simply downloading these templates, you can rapidly design a presentation that suits your needs because the slides are simple to use and adaptable.
Template 7: IT Project Team Performance Monitoring Dashboard
Project managers require every bit of assistance they can get to keep things on track. A project management dashboard is one of the best tools for monitoring and evaluating ongoing progress. Keep your team on track with the help of SlideTeam's project dashboard for tracking team performance.
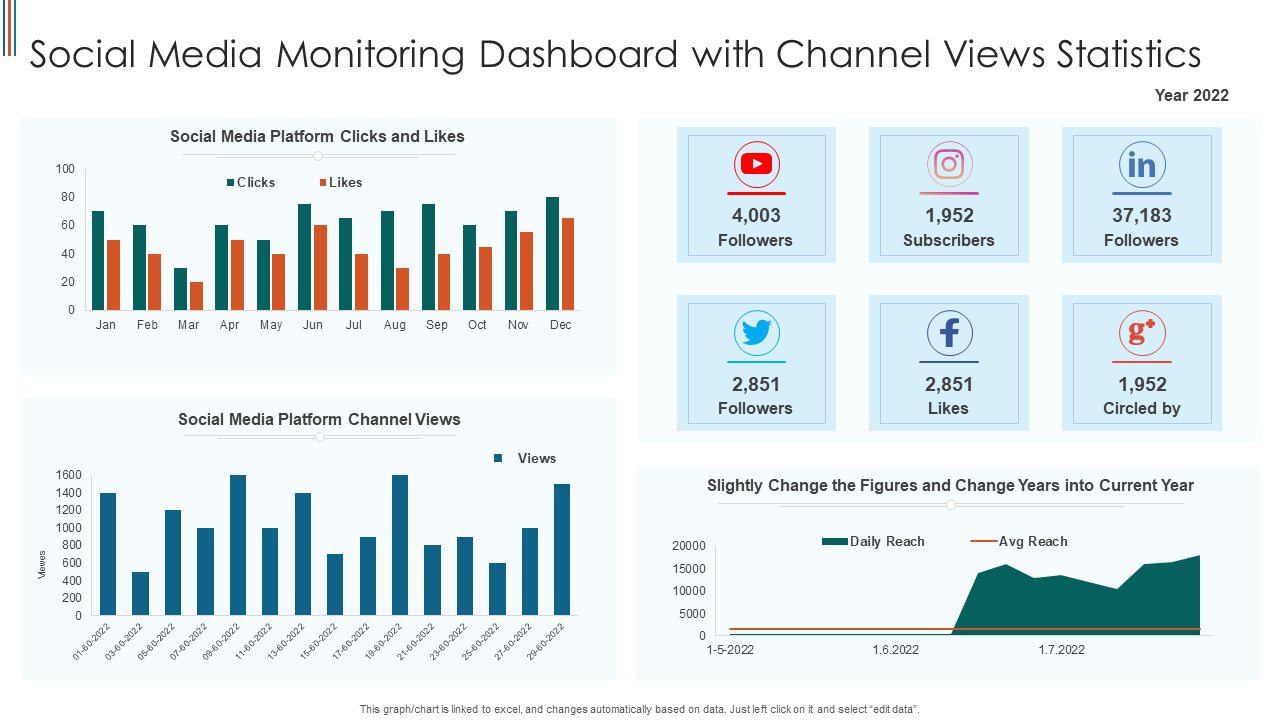
Template 8: Social Media Monitoring Dashboard
Your social media accounts, including Facebook, Twitter, and YouTube, can be consolidated in to one platform with the use of SlideTeam's social media monitoring dashboard. This template keeps track of key social media performance measures including engagement, subscriber or follower numbers, and audience insights.
Template 9: Social Media Monitoring Dashboard With Mention Numbers
This user-friendly dashboard makes the life of your managers easier in terms of planning and producing content. It also provides you with the insights you need to guide C-suite discussions on the direction the company should go. Additionally, it saves time that you can use more effectively on other projects. Discover why so many businesses are adopting this dashboard by downloading it right away!
Template 10: Vendor Compliance Monitoring Dashboard
Are you interested in tracking and enhancing the performance of your vendor-supplier business? Then, take a look at this dashboard for vendor monitoring. You can display vendor data using this collection of slides in an easily understandable format. Additionally, it assists you in identifying and reducing non-essential jobs so you may concentrate on those that contribute to the bottom line. Download this template now.
Template 11: Social Media Campaign Performance Monitoring Dashboard
This social media campaign dashboard template gives you information on the amount of money spent, click activity, and more. You can find out which campaigns are doing best and which need to be improved. We have slides on our social media dashboard for monitoring performance, developing content, communicating with users, reporting, analyzing competitors, etc. This social media dashboard's pre-built metrics can easily be modified to suit your needs.
Template 12: PSM Certification Training for Employees IT Risk Monitoring Dashboard for Software Development Projects
IT projects frequently include specific risks. Project managers can view the risk performance and the overall risk posture by using this dashboard. Additionally, it aids in immediately highlighting crucial business operations areas that demand corrective action.
Template 13: Facebook Monitoring Dashboard with Facebook Marketing Strategy for Lead Generation
Try out our Facebook monitoring dashboard if you own a marketing agency. Your company's online marketing performance can be tracked and evaluated using the SlideTeam dashboard's pre-built template options.
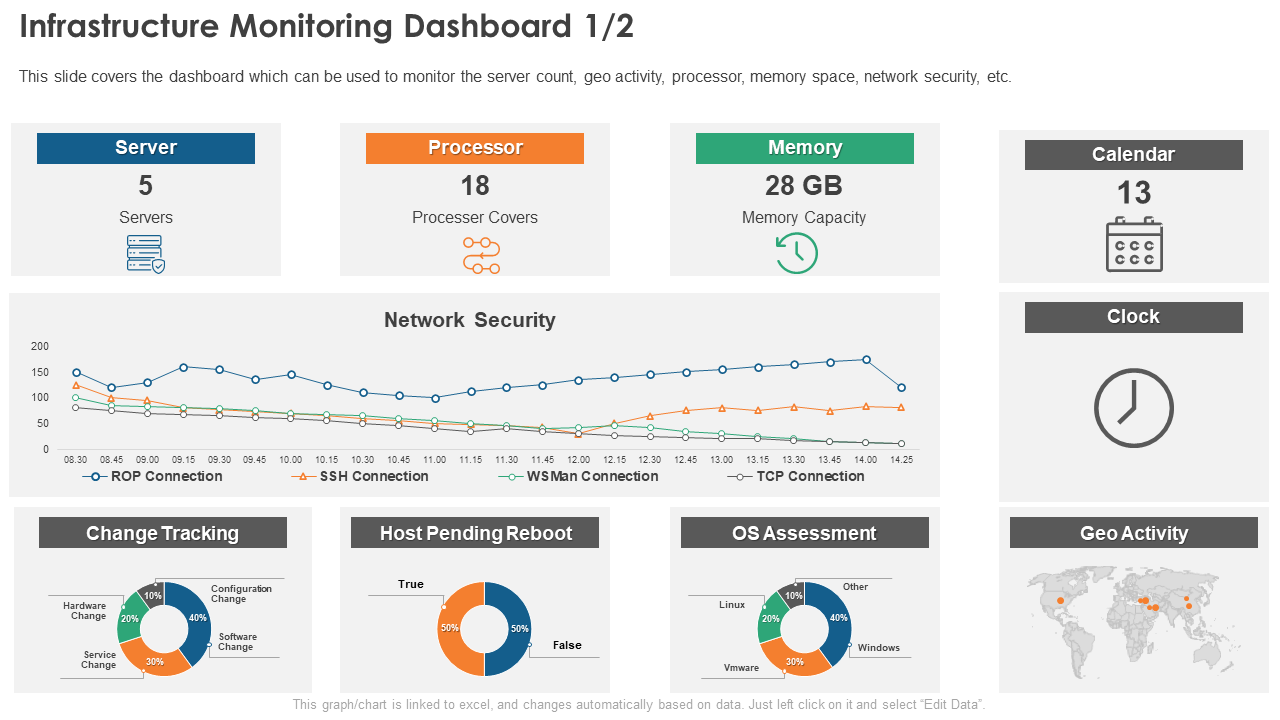
Template 14: Infrastructure Monitoring Dashboard
Any firm, no matter how big or small, has to manage its infrastructure. Using this dashboard, you can monitor the operation of your systems and identify potential issues before they result in system downtime or data loss. The best feature of this dashboard is how quickly you can personalize it to display only the data you find most significant. Download it from below.
FAQs on Monitoring Dashboard
What is a monitoring dashboard?
A monitoring dashboard is a cloud data analytics tool that helps track your business performance metrics in real time. Since monitoring dashboards feature an easy-to-use interface, digital marketers can quickly identify business bottlenecks and present business results to clients in easily digestible chunks. The idea is to ensure that there is always an element of supervision to your efforts.
Why do we need monitoring dashboards?
Dynamic monitoring dashboards have an intuitive user interface and don't have a steep learning curve. This makes it possible for any employee, without any prior experience, to create business dashboards in minutes. It streamlines the decision-making process for all employees. Since it encapsulates marketing KPIs and data sources all in one location, you can show how your business tactics affect your client's bottom line. It also helps in checking if corporate operations are proceeding as expected.
How do I create a monitoring dashboard?
You must logically design Monitoring Dashboards if you want to evaluate the state of the environment. We have listed a few steps below that you can use to construct a monitoring dashboard:
- Acquire the necessary information.
- Ascertain the need for monitoring.
- Produce a management module, if desired.
- Establish alerts for the parameters that will be tracked.
- Make an alert with a summary.
- Create a dashboard for the metrics that are being watched.
- Construct a dashboard to display the summary alert.
- Connect the metrics dashboard and the summary alert.




 Customer Reviews


