

Infrastructure Monitoring Dashboard Infrastructure Monitoring




Try Before you Buy Download Free Sample Product
 Impress Your
 Audience
 100%
100% Editable
 Save Hours
 of Time


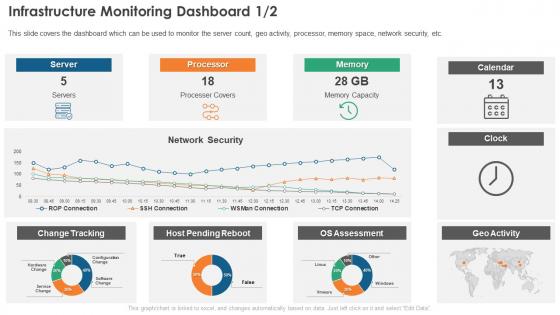
This slide covers the dashboard which can be used to monitor the server count, geo activity, processor, memory space, network security, etc.
People who downloaded this PowerPoint presentation also viewed the following :
Infrastructure Monitoring Dashboard Infrastructure Monitoring with all 2 slides:
FAQs for Infrastructure Monitoring
So the big four are CPU, memory, disk I/O, and network - that's your baseline for catching problems early. Response times and error rates matter way more though, because users will complain if stuff's slow regardless of how pretty your server stats look. Storage capacity sneaks up on everyone too. Database metrics are clutch. Oh and set alerts at like 80% utilization to start, then adjust based on what's normal for your setup. I learned that one the hard way when our monitoring was basically useless because everything was always red.
Dude, you gotta get real-time monitoring set up. It shows you exactly what's happening with your servers right now - like, you'll catch database issues before your users even notice anything's wrong. Way better than scrambling when people start emailing angry complaints, trust me. Set up alerts for the important stuff so you're not constantly refreshing dashboards (been there). You'll actually start seeing patterns too, which helps you fix things before they break. Honestly saved my butt more times than I can count. Just start with whatever services would hurt most if they went down.
Honestly, I'd just start with whatever your cloud provider gives you - CloudWatch if you're on AWS, Azure Monitor, or Google's monitoring stuff. They're already hooked up to everything. Datadog's really popular but gets expensive quick once you scale up. If you don't mind getting your hands dirty, Grafana + Prometheus gives you way more control. New Relic and AppDynamics are decent too, especially for app performance stuff. But yeah, definitely begin with the native tools to see what's actually happening, then decide if you need the fancy paid features later.
Set up priority levels - P1 for stuff that breaks customer-facing things (wake people up), P2 for performance issues during work hours, P3 for trend warnings. Here's the thing though - you gotta be brutal about which alerts actually deserve each level. Alert fatigue will absolutely murder your response times if you're not careful. Make sure everyone on your team agrees upfront what counts as P1 vs P2, because I've seen too many places where everything becomes "urgent." Clear escalation rules help too.
Look, automation saves you from constantly babysitting your infrastructure. It catches weird stuff happening, sends alerts, scales things up or down automatically. Even fixes basic problems while you're sleeping - which is honestly pretty sweet. Without it you'd spend all day putting out fires instead of actually building anything. The cool thing? It gets smarter over time, so you get fewer false alarms. I'd start with setting up automated alerts for your critical stuff first. Then maybe add some scripts that auto-fix your most annoying recurring issues.
Dude, you gotta get monitoring set up if you haven't already. It watches your CPU, memory, disk space - all that stuff 24/7 so problems don't sneak up on you. Way better than finding out your server died when users start calling angry, trust me. The alerts ping you when something's getting sketchy, like disk space hitting 85% or whatever threshold you set. Then you can actually fix things before they become a disaster. Honestly saved my butt more times than I can count. Just don't go crazy with the alert sensitivity or you'll hate your phone.
Multi-cloud monitoring is honestly a mess. Each provider has their own APIs and formats - AWS CloudWatch won't play nice with Azure Monitor or Google's stuff. Tracing problems across platforms becomes this huge headache because nothing talks to each other properly. Security models are totally different too, plus you're juggling separate cost structures and compliance rules. I swear it's like trying to manage three completely different systems at once (which I guess you are, lol). Get a unified platform that pulls everything into one dashboard - saves your sanity.
Honestly, just bake monitoring right into your CI/CD pipeline from the start. When you deploy code, your monitoring should go with it - no exceptions. I've watched too many teams scramble for days over bugs that decent alerts would've caught in minutes. Use infrastructure-as-code for your monitoring configs too, makes life way easier. Don't treat it like some separate thing you'll "add later" - that never happens. Build health checks into your apps and automate the alert setup during deployments. The whole shift-left thing really works here.
Yeah, security's massive when you're dealing with monitoring tools - they basically get the keys to everything. Encrypt all your data transmission and set up strong auth, ideally MFA. Oh, and don't go overboard collecting metrics like I did once - accidentally logged way too much sensitive stuff. Limit access to only people who actually need it. Your monitoring infrastructure needs to be hardened and patched regularly too. These systems are huge targets for attackers. Audit who's got access pretty frequently because that list tends to grow over time.
Dude, infrastructure monitoring is clutch for compliance stuff. When audit season hits, you'll have all that documented proof ready to go - uptime records, security events, who accessed what data. SOX, HIPAA, PCI-DSS all want you tracking this anyway. Trust me, it beats scrambling through random logs at the last minute. Your dashboards basically become your evidence that you're not just claiming to have controls but actually running them. Oh, and set up those automated reports now because manually exporting everything when auditors show up is the worst. Makes the whole process way less painful.
Dude, monitoring is a total lifesaver - wish I'd figured this out earlier tbh. You get real-time data on what's actually happening with your servers instead of just guessing. Found so many overprovisioned machines just burning money for nothing. Plus you'll catch bottlenecks before they tank everything, which saved my ass more times than I can count. The evidence-based decisions are what really matter here - no more shooting in the dark about CPU or memory needs. Start with your most critical stuff first. Way less stressful than the old "pray and hope" method we used to do.
So ML can actually catch patterns in your infrastructure that you'd totally miss - it looks at tons of historical data to predict server crashes, storage running out, network issues. Way better than those basic threshold alerts (which are kinda useless tbh). The models learn what's normal for your system and spot weird stuff before it breaks everything. You can see disk failures coming days ahead, predict traffic spikes, even catch those nasty cascade failures. Though honestly? Start small with one critical system and get better metrics first.
Focus on the "golden signals" first - latency, traffic, errors, and saturation. That covers like 80% of what you actually need. Don't set alert thresholds too tight or you'll hate yourself when your phone buzzes at 3am over nothing (trust me on this one). You want both infrastructure and app-level monitoring, plus centralized logging to connect the dots when things break. Dashboard the stuff that actually matters to your business, not whatever looks flashy. Oh, and test your alerts regularly - if you can't immediately fix what triggered it, why are you even alerting on it?
Honestly, just figure out what you're actually monitoring first - your servers, apps, network stuff. Team size matters too since some tools are a total pain to set up (trust me on this one). Budget's obviously a thing, plus you'll want something that plays nice with whatever you're already using. Prometheus is solid if you don't mind getting your hands dirty with open-source. Enterprise stuff costs more but they actually help you out when things break. My advice? Don't get paralyzed by all the options. Grab something that hits your main requirements and can scale up later - you can always bolt on other tools as you go.
Dude, alert fatigue is brutal - I got slammed with 200 Slack pings one night because our thresholds were garbage. Start small with just your critical stuff first. Teams working in silos is another nightmare since nobody sees how services depend on each other. Monitor actual user experience, not just server stats (learned that one the hard way too). Oh, and write runbooks for your alerts or you'll hate yourself at 3am. Don't try monitoring everything at once. Review your setup regularly as things change - what worked six months ago probably sucks now.
-
SlideTeam offers so many variations of designs and topics. It’s unbelievable! Easy to create such stunning presentations now.
-
One-stop solution for all presentation needs. Great products with easy customization.