


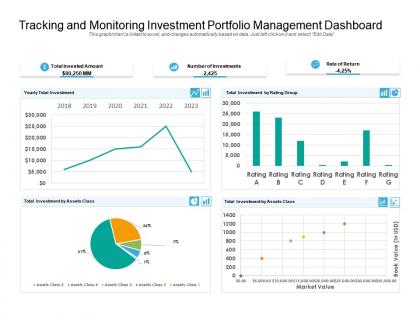
Tracking and monitoring investment portfolio management dashboard




Try Before you Buy Download Free Sample Product
 Impress Your
 Audience
 100%
100% Editable
 Save Hours
 of Time


Our Tracking And Monitoring Investment Portfolio Management Dashboard are explicit and effective. They combine clarity and concise expression.
People who downloaded this PowerPoint presentation also viewed the following :
Tracking and monitoring investment portfolio management dashboard with all 2 slides:
Give your audience a fulfilling experience. They will find our Tracking And Monitoring Investment Portfolio Management Dashboard elevating.
FAQs for Tracking and monitoring investment
Start with portfolio value and performance - that's what hits you first anyway. Break it down by asset types like stocks, bonds, cash, then list your individual holdings with current values and gains/losses. Performance charts over time are clutch, though I probably check mine obsessively when the market's freaking out. Dividend tracking is solid too. Benchmark against S&P 500 so you know if you're actually doing decent or just riding the wave. Keep it simple at first - you can get fancy with more metrics once you're not overwhelmed by the basics.
Real-time data integration turns your portfolio dashboard into something that actually moves with the markets instead of just sitting there like a dead fish. Price changes, P&L swings, risk metrics - everything updates instantly so you don't have to keep hitting refresh like some kind of maniac. Once you're used to it, going back to static reports feels like using dial-up internet again. You'll catch problems and opportunities way faster, which obviously helps with making quicker trades. Markets move fast these days. I'd focus on getting your most critical data feeds connected first - no point overwhelming yourself with every possible metric right out of the gate.
Start with your total portfolio value and return percentage - that's what actually matters day to day. Then break down your asset allocation and how each position is doing. Dividend yield's worth tracking if you're into that. Risk stuff like volatility and beta matter too, but honestly I ignored those for way too long until I learned the hard way. Cash flow and sector breakdown are solid additions. Just don't go crazy with metrics or you'll never check it. Maybe start with 5-6 basics, then add more once you've got a routine going.
Dude, charts and graphs are game-changers for portfolio stuff. Raw numbers in spreadsheets? Total nightmare - I've missed way too many warning signs that way. Heat maps show you instantly if something's tanking, and those trend lines make it super obvious when you need to rebalance. I love setting up dashboards that track what actually matters for my strategy. You can spot when your asset allocation's drifting or when sectors are getting weird. Honestly beats staring at endless rows of data trying to figure out what's happening. Just focus on the metrics you care about and let the visuals do the heavy lifting.
For simple stuff, Excel and Power BI work great - honestly Power BI's pretty solid if you're already used to Excel. Tableau's another big one everyone talks about. Python with Plotly or R with Shiny are amazing if you can code, but yeah... that learning curve hits hard. Bloomberg and FactSet have dashboard features built in, though they cost a fortune obviously. Google Data Studio's decent for web stuff, plus there's specialized platforms like Addepar. I'd probably just start with whatever you're comfortable with already - makes the whole transition way less painful.
So these portfolio dashboards are actually pretty sweet - you can totally customize them for whatever you're trying to do. Like if you're young and don't mind risk, maybe go 80% stocks. More conservative? Drop it to 40%. The whole thing tracks your specific goals too, whether that's retirement or saving for a house or whatever. I've been playing around with mine lately and it's wild how it changes the metrics based on what you care about most - growth vs income vs just not losing money. Just plug in your timeline and how much risk you can stomach, and it'll spit out suggestions that actually make sense for your situation.
Honestly, you really need mobile access for your portfolio stuff. Markets don't wait for you to get home, right? I'm always checking mine when random news hits - like waiting in line somewhere or on the train. Quick trades, alerts, seeing how badly (or well) things are doing... all that needs to work smoothly on your phone. The worst is when companies just shrink their desktop version down and call it "mobile friendly." Total nightmare to navigate. Make sure yours actually works with touch and doesn't require tiny precise taps. Test it yourself regularly because you'll definitely need it when you're not expecting to.
So with customizable templates, you can basically arrange your dashboard however makes sense for your investing style - growth stocks, dividends, whatever you're into. The cool thing is saving different layouts for different purposes. Like, I'll have one setup for my quick morning checks and totally different widgets for when I'm doing actual research. No more hunting through stuff you don't care about. Your key metrics are just... there. And switching between views takes like two seconds depending on what you're looking at that day. Honestly worth setting up even if it feels tedious at first.
Don't overcomplicate it with every possible metric - stick to what users actually care about. Portfolio value and performance need to be front and center. Then add your asset allocation, holdings, risk stuff underneath. God, some dashboards look like someone threw up a box of crayons. Keep your charts clean and readable. Consistent time periods are key, plus let people filter by dates or asset types easily. Always show benchmark comparisons so they know if they're winning or losing. Oh, and test with real people first - you'll catch obvious problems you missed.
Interactive line charts are definitely the way to go - let people zoom into whatever timeframe they want. I always throw benchmark comparisons right on there too so you can actually see how you're doing vs the market. Oh and definitely add a summary panel up top with the key stuff: total return, volatility, max drawdown. Some people care about dollar amounts, others want percentages, so include both views. Start with 1-year as default but make it super easy to jump between 1M, 3M, 1Y, 3Y. Honestly the toggle buttons should be obvious - hate when dashboards make you hunt for basic controls like that.
Definitely start with MFA - can't stress that enough. Encrypt everything in transit and set up role-based permissions so people only access what they need. Rate limiting on your APIs will literally save your ass down the road, trust me on that one. Session timeouts are a must, obviously. For data storage, be extra paranoid with financial stuff - encrypt at rest too. Oh and comprehensive logging for audits, because finance regulators love their paper trails. Actually, that reminds me - make sure your token management is bulletproof from day one. These fundamentals will get you pretty far.
So automated alerts are basically like having someone watch your investments for you. They'll ping you when stuff happens - stock hits your target price, drops below your stop-loss, whatever you set up. You can track portfolio changes, sector movements, even news about your holdings. Honestly saved my butt so many times when I couldn't check my phone for hours. Just don't set up a million alerts or you'll start ignoring them all (learned that the hard way). Way better than constantly refreshing your trading app like a maniac.
So I'd start with just one sentiment data source - maybe Twitter feeds or news sentiment for your stocks. Real-time sentiment scores are pretty useful, especially when you see how dramatic the swings can get (Twitter reactions are honestly wild sometimes). Set up alerts for when public opinion shifts hard on your holdings. Sentiment trend charts work great alongside your regular price charts too. The cool thing is you can spot potential moves before they hit stock prices. Oh, and sentiment filters help flag buying/selling opportunities. Don't overcomplicate it at first - build from there once you see what works.
Dude, collaboration features are honestly amazing - no more endless email chains with Excel attachments flying around. Your clients can jump into shared portfolios, drop comments on specific investments, and you can set alerts for when things hit certain levels. What I love most is how transparent it makes everything. Clients see your actual reasoning behind decisions instead of getting some generic quarterly PDF in their inbox. They can ask questions or raise concerns right there on the dashboard too. The trust factor alone makes it worth it, though I'd probably start small - maybe test it with just your top few clients first to see how they like it.
Honestly, stale data feeds are gonna be your worst nightmare. You'll think everything's running smooth until you realize Tesla's showing last Tuesday's price - super frustrating. Real-time APIs cost a fortune and still break randomly. Different sources update at weird intervals too, some delayed like 20 minutes. Market holidays are another pain since exchanges don't all close together. Build alerts when data hasn't updated in X minutes - trust me on this one. You need backup sources and solid error handling, otherwise you'll make trades based on garbage numbers. Learned that the hard way.
No Reviews