


Service management dashboard for it company





Try Before you Buy Download Free Sample Product
 Impress Your
Audience
 100%
Editable
 Save Hours
of Time


Our Service Management Dashboard For IT Company are topically designed to provide an attractive backdrop to any subject. Use them to look like a presentation pro.
People who downloaded this PowerPoint presentation also viewed the following :
Service management dashboard for it company with all 2 slides:
Use our Service Management Dashboard For IT Company to effectively help you save your valuable time. They are readymade to fit into any presentation structure.
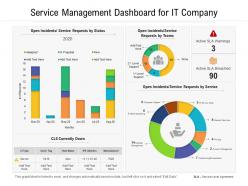

FAQs for Service management dashboard
Focus on stuff that actually tells you if things are broken - incident response times, how fast you fix problems, and whether you're hitting your SLAs. Track uptime and customer satisfaction too, obviously. Oh and make sure work isn't all dumped on one person (learned that the hard way). Honestly, resist the urge to build a million dashboards because nobody looks at them anyway. Throw in some trend tracking so you can catch issues early. Keep everything dead simple - if your team can't glance at it during standup and immediately know what's up, it's too complicated.
So basically, these dashboards let you see everything happening in real-time instead of flying blind. You can catch problems early, spot weird patterns in your tickets, find where resources are getting bottlenecked - that kind of stuff. Honestly, once you get used to having all your data in one spot, going back to juggling multiple tools feels insane. The best part? You stop putting out fires all day and actually get ahead of issues. My advice would be pick your biggest 3 headaches first and track those. Don't try to monitor everything at once or you'll go nuts.
Dude, real-time data turns your Service Management Dashboard from eye candy into something that actually saves your butt. You'll spot incidents and performance issues as they're happening, not after customers are already screaming. Short bursts work better than long monitoring cycles, trust me on this one. Jump on problems fast and you can stop them from becoming total disasters. Your team can figure out what needs attention first and track how fixes are going. Oh, and definitely set up those automated alerts - way better than playing catch-up when everything's already on fire.
So first thing - get actual users to test your dashboard before you fall in love with it. User testing sessions are gold. Surveys work too, but honestly? Watching someone get confused for 30 seconds teaches you way more than any form ever will. Map out who's using this thing daily and how they work. Then let them mess around with prototypes and see what breaks. Ask about layout, which widgets they actually need, what metrics matter for their job. Oh, and don't forget to keep checking in after launch - people's needs change constantly. Trust me on this one.
Honestly, stick with the classics for service dashboards - red/yellow/green lights are perfect for quick health checks. Line charts show your performance trends over time, and heat maps make it super easy to spot trouble areas. Bar charts work well when you're comparing stuff like ticket volumes or SLA performance. Skip pie charts though - they're pretty useless unless you need a really basic breakdown. Oh, and make everything scannable. Your stakeholders need to get the gist in like 5 seconds, otherwise they'll just glaze over and miss the important stuff.
So basically it gives everyone visibility into what's actually going on instead of playing that annoying game of telephone with incident updates. You'll see ticket flows, SLA stuff, resource allocation - all in real-time. IT can pinpoint bottlenecks for other teams while business units track their requests without bombarding you with follow-ups. Honestly the transparency alone kills those pointless "what's happening?" meetings. Oh and set up automated alerts so stakeholders stay in the loop without you manually updating everyone constantly. Game changer for sure.
Honestly, data integration is gonna be your worst nightmare. All these systems - ticketing, monitoring, whatever ancient stuff you're stuck with - they just refuse to talk to each other. Getting people to agree on metrics? Good luck with that mess. Everyone's got their favorite numbers they swear by. You'll also deal with crappy data quality and the usual pushback when you try changing anything. Oh, and scope creep - suddenly every department wants their special dashboard. My advice? Pick like 3-4 metrics everyone actually cares about first. Build from there once you've proven it works.
API integrations are your friend here - they'll pull data straight from your ticketing systems and monitoring tools into your dashboard automatically. No more manual exports. Seriously, I've watched teams go from spending hours on this stuff to having it all update in real-time. ServiceNow and Jira APIs are pretty solid for this kind of thing. You can also set up scheduled scripts that grab data from different sources and dump it all in one place. Honestly? Start with whatever's eating up most of your time manually, then build from there. Once you get the first one working, you'll wonder why you didn't do this sooner.
So basically your Service Management Dashboard turns into compliance headquarters. It tracks audit trails, SLA stuff, and regulatory metrics automatically - no more digging through endless spreadsheets at 2am (been there). You can set alerts when policies get violated and monitor who's accessing what. Honestly, the automated reporting alone is worth it since compliance reports are such a pain to pull together manually. Plus it collects evidence for audits and catches governance issues early. I'd start with automating reports for your biggest compliance headaches first. Trust me, future you will be so grateful when audit season rolls around.
Think about what each person actually does all day. Executives want the big picture - KPIs, trends, that stuff. Service desk folks need their ticket queues and alerts firing in real time. Managers are stuck in the middle wanting team stats and operational health. Here's the thing though - don't get crazy with customization or you'll hate yourself later when everything breaks. Map out what decisions people make daily, then only show data that helps with those specific choices. Most platforms have role-based permissions anyway, so just use those to filter out the clutter. Keep it simple.
ServiceNow's probably your best bet for ITSM dashboards - that's what it's made for. Jira Service Management and Freshservice are solid too. If you need something more custom, Power BI or Tableau can pull from anywhere. Oh, and don't sleep on Grafana if your team's technical - it's surprisingly flexible for this stuff. Honestly though? Start with whatever plays nice with your current systems. I've seen too many teams get caught up in shiny features when they should've just picked the thing that actually works with their setup first.
So basically, historical data turns your dashboard from just showing what's happening now into seeing the whole story over time. You'll catch patterns and spot problems before they blow up. Compare weekly, monthly, quarterly stuff - helps you tell real trends from random weirdness. Honestly, I'd start by looking at your current numbers against last year same time. It's way better than guessing what might happen next. You can actually see which changes worked and predict what resources you'll need. Like having a decent crystal ball that doesn't lie to you.
So you've got a bunch of options with that dashboard. Incident reports are solid for tracking ticket volumes and how fast stuff gets resolved. Performance reports show if you're hitting your SLAs. Then there's trend analysis - honestly that one's clutch because you can catch problems early. Oh, and availability reports for your services plus team productivity stuff. Most of these export to different formats which is nice. I'd probably start with incident and SLA reports first - gives you the real picture of how your team's doing day to day.
Most service management dashboards can hook up with other systems pretty easily these days - usually through APIs or those pre-built connectors. Start with whatever system has your most important data, like your CRM or ERP. The trick is making sure the data fields actually match up between platforms so everything syncs properly. Set up automatic syncing instead of doing manual exports (learned that one the hard way). Some dashboards are honestly way more plug-and-play than I expected. Focus on connecting your critical systems first - you'll see results faster that way.
Check your dashboard weekly - catches problems before they snowball. Automated validation saves you from mind-numbing manual checks (learned that one the hard way). Ask your stakeholders what they actually use vs what just looks pretty on screen. Delete old widgets instead of hoarding them like digital pack rats. Document changes so future you doesn't curse present you. Honestly, start by asking users what they'd miss if stuff vanished - you'll be surprised how much is just noise.
-
Great experience, I would definitely use your services further.
-
Design layout is very impressive.