





 0 Comment
 Customer Reviews

Are you looking for ways to optimize energy usage, lower costs, and ensure sustainability? If yes, leveraging an energy monitoring dashboard is an excellent idea. These dashboards can help in real-time monitoring of energy consumption and assist in better utility management, energy optimization, and carbon footprint reduction. The monitoring dashboard combines critical data and displays it in one place. So, you can gain better energy insights and improve your decision-making.
Click here to explore our top monitoring dashboard templates.
However, building the dashboards from scratch is tough. Especially when your business already has a lot to handle, it becomes all the more challenging. That is where the attractive, content-ready templates of SlideTeam prove to be beneficial.
Browse through our analytics dashboard templates and handle your organization data with ease.
Our energy monitoring dashboard templates provide a comprehensive view of energy data and enable you to take immediate action. The best part is that the learning curve of the template is simple and straightforward. You can use them conveniently and save valuable time. Moreover, they are 100% editable and customizable. That means you can edit individual slides and add content to fit your needs.
Moving towards sustainability? Use our sustainability templates right away!
This blog will take you through the top 10 energy monitoring dashboard templates. Let’s explore!
Template 1: Power Plant Energy Consumption and Monitoring Dashboard
Are you an energy supplier looking for ways to optimize production and ensure better energy management? Use this template to understand the fast-changing market demands, evaluate and manage production costs, and obtain greater profitability in the long run. The key aspects covered in the template are total energy consumption, different energy sources, energy consumption by sector, and average production costs. Grab this template for a clear picture of energy consumption and take the necessary actions on time.

Template 2: Energy Monitoring Dashboard with Emission Rate
Use this template to gain a comprehensive view of the energy consumption and emission rate of a facility on a monthly basis. The core aim is to understand the level of energy consumption and potential emissions and determine effective ways to optimize them. The simple design and enhanced data visualization enable facility owners to get a clear picture and take the right actions.

Template 3: AI Energy Management and Monitoring Dashboard
The use of artificial intelligence for effective energy management is on the rise. This template sheds light on the key aspects of AI energy management systems. The template allows you to determine the energy consumption of homes, solar power, power nest, and grids. You can also get an idea of the total active alarms for the potential energy issues. As a result, managing the problems and improving energy efficiency becomes easy.

Template 4: Energy Consumption Monitoring and Tracking Dashboard
Want to keep track of the energy consumed in your home? Besides total consumption, this template offers you a breakdown of the energy consumption in individual rooms. The core aim is to offer greater clarity of the rooms that consume maximum energy and effectively optimize them to lower utility bills. This template is perfect for homeowners looking to manage their energy consumption and maximize savings.

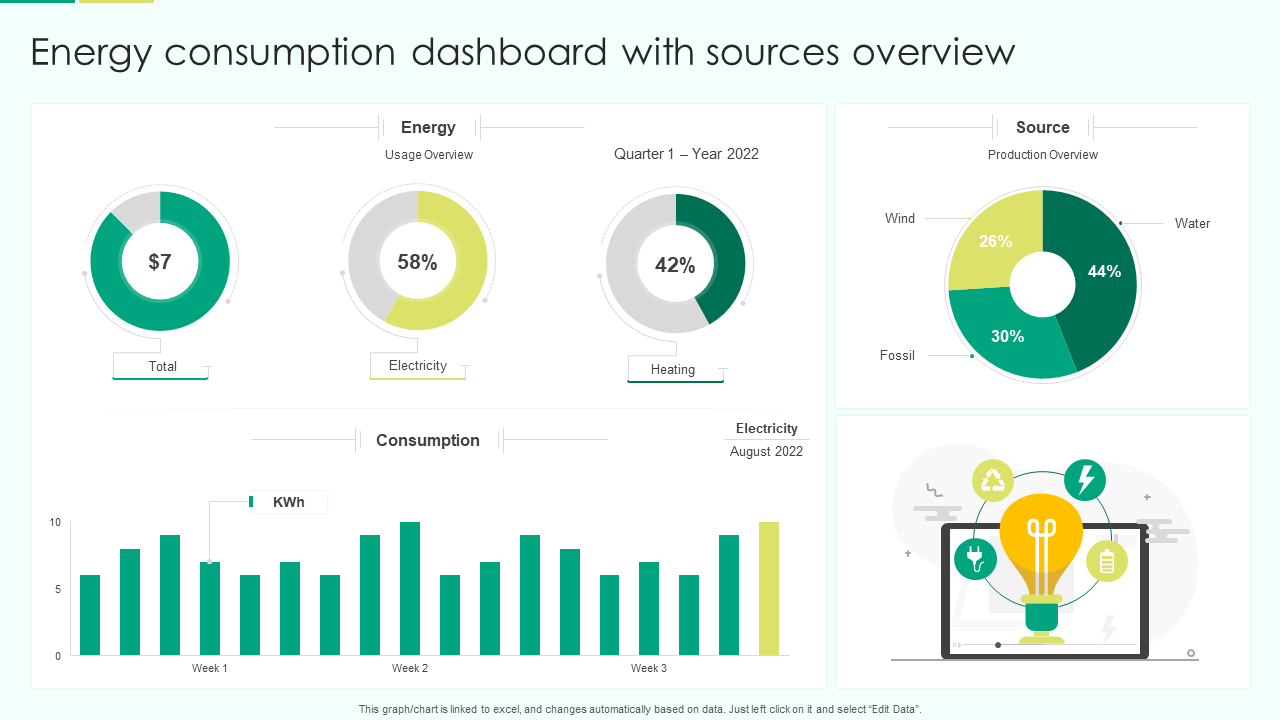
Template 5: Energy Consumption Dashboard with Sources Overview
Manage and optimize your energy consumption with our professional template. Use this template to gain insights into the total energy consumption along with the different sources contributing to energy production. The simple layout and impressive visuals make the template more appealing and ideal for businesses, enabling them to effectively lower energy usage.
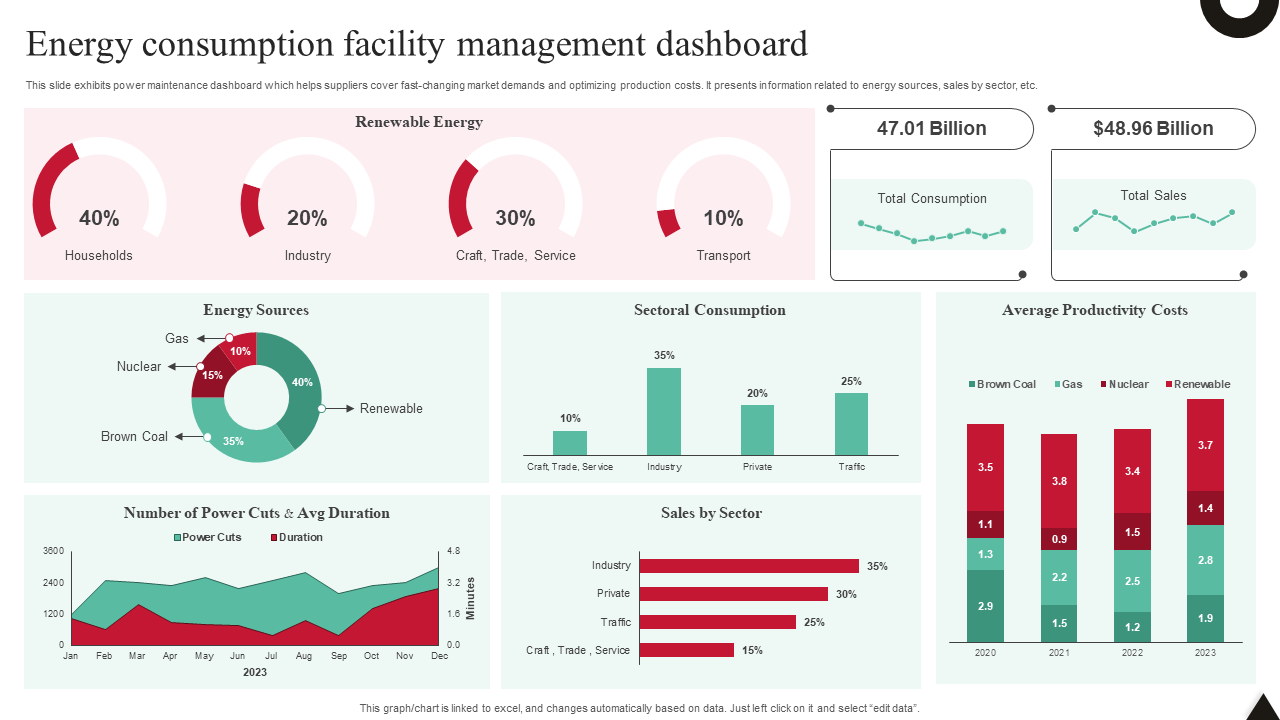
Template 6: Energy Consumption Facility Management Dashboard
This template is ideal for energy suppliers as it allows them to understand the changing market demands and optimize production costs effectively. Right from the amount of renewable energy consumed by different sectors to sectoral consumption, average production costs, energy sources, sales by sectors, and the number of power cuts, everything is covered in the template. Download this template and manage energy production with ease.
Template 7: Smart Energy Monitoring Management KPI Dashboard
Smart metering is a growing trend in recent times. This template allows for efficient monitoring and management of smart energy. The key aspects highlighted in the template are projected costs, change in cost, usage estimate, active appliances, energy intensity, and carbon footprint. Use this template to understand usage and carbon emissions and take the right actions to lower them.

Template 8: Dashboard to Track Energy Efficiency in Business Plant
Running a business plant is no easy task. This template focuses on monitoring and enhancing the energy efficiency of business plants, leading to less waste of energy and increased cost savings. The aspects covered in the template are sector-wise energy consumption, total energy consumption, total sales generated, plant energy sources, sector-wise sales, renewable energy consumption, and mean production cost.

Template 9: Problem Management Dashboard for Energy Consumption
Energy suppliers may come across various problems. Addressing them at the right time is the need of the hour. This template provides a complete picture of energy consumption and enables energy suppliers to monitor various aspects in one place and plan appropriate strategies to resolve the problems faster. From energy consumption by sector to energy sources and sales by sector, everything is covered in the template for better energy management

.
Template 10: Power Plant Energy Production Dashboard for Consumption
This template provides the energy suppliers with a complete view of power plant energy production. It covers crucial aspects like total capacity, target, and energy generated. Use this template to compare the energy production rate for different locations and check the status. Moreover, you can also get an idea of the return on investment in each location.

Template 11: Energy Management KPI Dashboard with Consumption Rate
Looking for energy analytics? This template is the apt choice for you. The template covers all the crucial KPIs essential for effective energy management. The core aim is to help the energy suppliers to enhance their profitability in the long run. For total sales to consumption by sector and average production cost, everything is clearly highlighted in the template.

Template 12: Dashboard to Track Energy Saving
Want to enhance your energy saving? Use this template to track the effectiveness of your implemented program and promote better energy savings. The key aspects highlighted in the template are electric vs. gas allocation, changes in cost, cost projection, equipment activity, budget load, and carbon emissions and energy consumption. Download this template right away and simplify energy-saving tracking.

Template 13: IoT Energy Monitoring Application KPI Dashboard
The use of IoT has been on the rise in recent times. This template sheds light on the KPI dashboard for IoT energy monitoring. The core aim is to keep a tab on the energy consumption levels with the use of the latest IoT technology. The key KPIs highlighted in the template are total power consumption, average consumption per day, energy consumed per day, and weekly energy consumption. Compare these consumption levels and figure out strategies to effectively optimize them.

Template 14: Energy Consumption Dashboard with Production Costs
Keep track of energy consumption and optimize it with the help of our expertly crafted template. The key aspects covered include total consumption, consumption by sector, energy sources, production cost, number of power cuts, and sales of energy units by sector. Get this template and simplify energy management with ease.

SUSTAINIBILITY HAS TO BE BUILT IN BUSINESS PLAN
The world is moving towards sustainability. So, businesses look for ways to optimize their energy consumption, reduce costs, and contribute towards sustainability. To ensure optimum success, having a clear understanding of your consumption level is the need of the hour. Our templates are meant to provide a comprehensive overview of energy and power usage and empower businesses. Our templates are easy to use and can be easily tailored to fit your needs. Get the templates right away and simplify your tasks like never before!
FAQs
1. What types of energy consumption data are displayed on the dashboard?
The energy consumption dashboard displays aspects, such as total energy consumption, average usage, energy consumption patterns over time, energy costs, and carbon emissions. The core aim is to provide users with a complete picture of energy consumption and costs and empower them to develop strategies to lower usage and ensure better cost savings.
2. How are real-time energy usage trends visualized?
The trends of real-time energy usage are usually visualized with the help of dashboards. They aid in displaying the crucial data in an easy-to-understand manner. The interactive graphs and charts make it easier for the users to grasp the vital data in a single glance and understand the changing trends and patterns in a hassle-free manner.
3. What are the key performance indicators (KPIs) tracked for energy efficiency?
The most common KPIs used for tracking energy efficiency are energy consumption, renewable energy usage, carbon emissions, and energy cost. These KPIs allow organizations to gain better insights into their energy usage patterns and identify the areas of improvement for better outcomes. However, a point to note here is that the KPIs may vary from organization to organization.


