

 0 Comment
 Customer Reviews

Remember the Berlin Airport fiasco? Scheduled to open in 2011, it finally did—nine years late and billions over budget.
What went wrong? Poor oversight, scattered communication, and project managers operating without checks. It’s a cautionary tale that still haunts the construction world and proves clearly without real-time visibility on progress and supervision, even the best blueprints crumble.
When you work in construction, you are not piling concrete; you are juggling labor, logistics, schedules, budgets, and clients' expectations, all while keeping safety inspectors happy. It is chaos… unless you are monitoring it. This is where a construction dashboard comes in, your mission control of the whole project lifecycle.
SlideTeam has curated a list of the Top 10 Manufacturing Dashboard Templates for you. Click here to explore.
SlideTeam has created Construction Dashboard Templates to save you the pain of creating one yourself. These engaging, 100% editable and customizable PowerPoint presentations help you monitor KPIs, progress, risks, costs, and resource allocation like a pro.
Let's explore the templates that hold your project on its feet when all other forces are out to bring it down.
Template 1: Construction Dashboard PowerPoint Template for Project Management
The PowerPoint Presentation provides an in-depth introduction to the implementation of a construction dashboard to manage the project. It points out the key areas of budget monitoring, time management, and risk analysis, and it pays much attention to the necessity of real-time data integration, communication with stakeholders, and user-friendly interface design. The slides explain the advantages of dashboards in maximizing resource utilization, cost management, and quality assurance. The best practices and common challenges to dashboard implementation are also discussed, which can be used as actionable insights to successfully implement them.
[product_image id=1453486]
Template 2: Construction Project Monitoring and Control KPI Dashboard
This KPI dashboard of project monitoring and control in construction offers a complete picture of the key performance indicators vital to successful project management. It also has real-time statistics like the project work status, project stage distribution, completion percentage, and budget use. The dashboard shows 101 percent used budget, 365 days of total duration, and clear visualisations of budget variance and resource planning. It also contrasts actual vs. planned resources, workload distribution, and monitors progress. This tool provides practical information about the project schedule and resource utilization, and financial management during the project life cycle.

Template 3: Dashboard for Monitoring IoT Progress and Budget Utilization of Construction Project
This is an IoT-based construction project dashboard that provides real-time tracking of progress and budget spend on a commercial building project. The most significant indicators are the completion rate of 61%, the Schedule Performance Index (SPI) of 0.9, and the Cost Performance Index (CPI) of 1.15, which means that it was cost-effective even though the schedule was not met. The cost analysis shows the largest cost to be labor (40%) and material (37%), with a breakdown of spending on equipment, subcontractors, and foreign labor. A performance trend graph monitors planned work, executed work, and actual costs monthly, between January and December, and allows for making decisions based on data.

Template 4: Construction Project Progress Status Dashboard
This PPT Set provides an overview of the ABC building construction project. It shows the timeline of the task, the milestones, and the statuses of the tasks in numbers as in progress, done, and not started. The distribution of task priority indicates that 70 percent of the activities are of high priority. The dashboard also monitors pending items, and decisions and change requests are the most delayed. An obvious comparison of the budget indicates that the actual expenditure was 55,000 dollars against a budget of 85,000 dollars. This dashboard helps project managers track progress, manage resources, and solve bottlenecks to ensure projects are completed on time.

Template 5: IT Construction Project Progress Status Dashboard
This PPT Slide provides a real-time picture of the most important project stages, which are completed (planning and design), under development (70 percent), and under testing. The dashboard shows the delays and upcoming deadlines of the tasks assigned to the team members and gives actionable visibility into delays. It also monitors the use of the budget, showing that it was overrun by what percentage of the budget, with the amount of dollars left. It is expected to be launched on December 20, 108 days ahead. The distribution of the workload per employee is also well illustrated, so that the management of tasks can be improved. This dashboard facilitates proactive decision-making and aligns the project with goals and timelines.

Template 6: Construction Management Dashboard with Productivity and Worked Hours
This PPT Dashboard offers a detailed picture of the team productivity and working hours, divided by the development and sales roles. It shows personal employee input in total hours worked, time with clients (actual and goal), and productivity standards. The dashboard also measures some of the critical satisfaction measures, such as work environment (80%), remuneration (60%), benefits (60%), and training (90%), with an overall construction management efficiency rating of 80%. The visual format assists managers in determining performance gaps and optimizing resource allocation. This dashboard will allow making data-informed decisions to increase productivity, satisfy clients, and have a well-balanced and efficiently managed construction workforce.

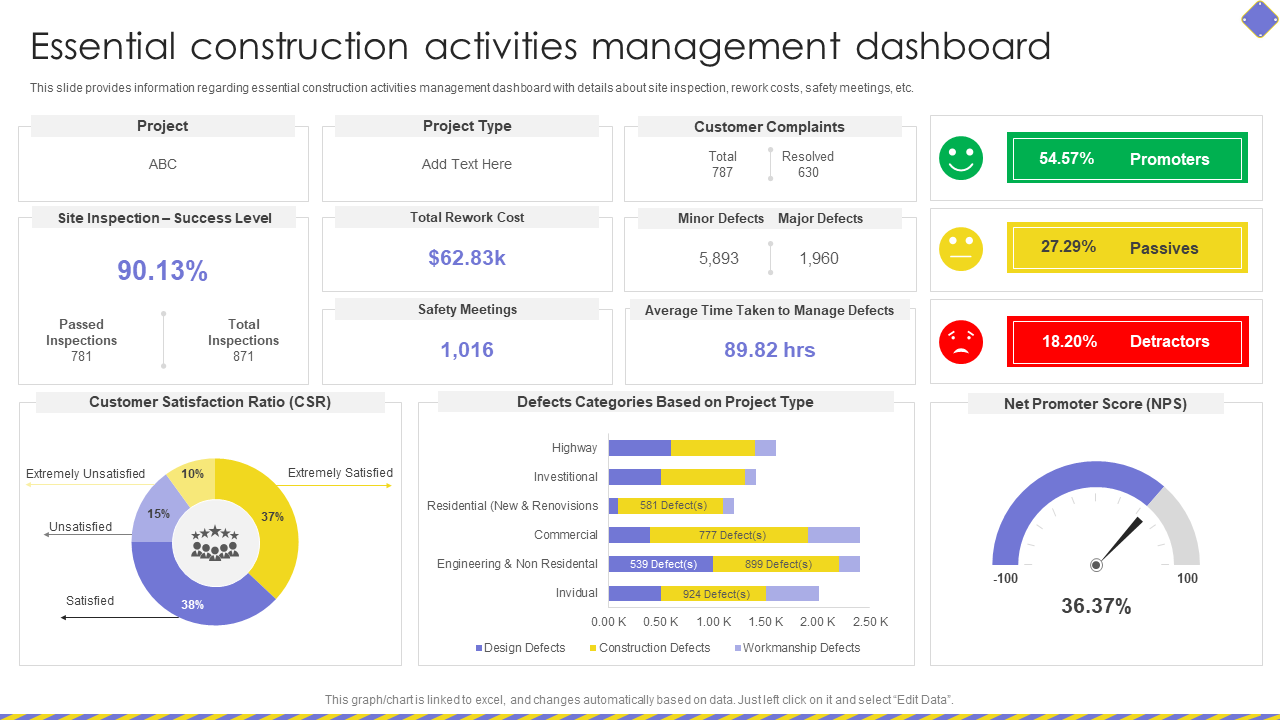
Template 7: Essential Construction Activities Management Dashboard
This PPT Preset gives an overview of the most important performance indicators, such as site inspections, defect tracking, safety meetings, and customer satisfaction. It points to a 90.13 percent success rate of site inspection, a rework cost of $62.83k, and an average defect resolution time of 89.82 hours. The dashboard provides actionable information with 1,016 safety meetings conducted and a breakdown of more than 7,800 defects by project type. The customer satisfaction ratio and Net Promoter Score (36.37%) represent the general quality of services, whereas the promoter score (54.57%) shows a high level of client advocacy. This dashboard facilitates the ongoing development of construction activities and quality management.
Template 8: Dashboard to Monitor and Control Construction Plan Execution
This dashboard monitors the execution of a construction plan and provides an overview of the health of the project, in terms of task status, progress, costs, schedules, and workload allocations. It shows that 56 percent of the tasks are not started yet, 9 percent of the tasks are completed, and 14 percent of the project is completed. The project is also doing well as it is 14 percent ahead of schedule and 42 percent under budget. There are no tasks that are overdue, and the work is equally distributed among the team members. Cost analysis involves comparing actual, planned, and budget costs, whereas progress is monitored at various stages, such as design, procurement, and construction.

Template 9: Capital Project Dashboard for Construction Quality Management
This PPT Slide gives an in-depth perspective of the KPIs in terms of quality assurance. It monitors Non-Conformity Reports (NCRs), standard operating procedures, site inspections, product quality ratings, and training activities. Of the total 52 NCRs, 48 are still open, and the ageing analysis shows delays. The dashboard indicates the SOP approval status, monthly site inspection, and quality training. The active NCRs are classified according to the type of issue, and the product quality ratings are posted in locations.

Template 10: Importance of Construction Dashboards
This PPT Set explains why construction dashboards are significant in contemporary project management. It emphasizes the fact that dashboards offer real-time information, assist in making informed decisions, and improve resource management. The visual also highlights the main advantages, such as risk monitoring, performance tracking, stakeholder engagement, cost control, and quality assurance. Construction dashboards enable managers to keep track of the progress of the project, deliver it on time, and maintain budgetary and quality standards by consolidating the data in a centralized, easily accessible format.

You Can’t Afford Another Berlin Airport
In construction, the blueprint may set the vision—but the dashboard keeps it real. From budget blowouts to timeline tangles, most project disasters don’t happen overnight—they build up silently through overlooked data and misaligned teams.
SlideTeam Construction Dashboard Templates will never leave you guessing, improvising, or waiting to be surprised. These templates will assist you in tracking the moving parts, identifying delays in time, and communicating effectively with all stakeholders involved. No matter what you are building, whether it is a local project or a multi-million dollar infrastructure project, these dashboards provide you with the one thing that construction does not often provide: control. Download these today!
P.S. Experts at SlideTeam realize that creating Production Dashboards is never easy (much like construction dashboards). Access our best-in-class Production Dashboard Templates with a click here.
FAQs on construction dashboard
1. What is a dashboard in construction?
A dashboard in construction is a digital instrument that offers a real-time visualization of the important performance indicators (KPIs) of a project, including budget, schedule, resources, and risks. It gathers data from different sources, such as spreadsheets and ERP systems, and presents it in an easily digestible form through charts, graphs, and other visualizations. This enables the project managers and stakeholders to get a quick overview of the status of the project, determine possible problems, and make decisions based on the available information.
2. What are the three types of dashboards?
There are three primary dashboard categories: strategic, operational, and analytical. These dashboards address the needs and management levels of various users and offer diverse details and emphasis.
3. What is building a dashboard?
The process of constructing a visual interface that gathers important data points, metrics, and trends into one, digestible view is known as building dashboards. These dashboards are aimed at giving a brief view of the performance, assisting users to find patterns, and enabling data-driven decision-making.