


Construction Project Progress Status Dashboard




Try Before you Buy Download Free Sample Product
 Impress Your
 Audience
 100%
100% Editable
 Save Hours
 of Time


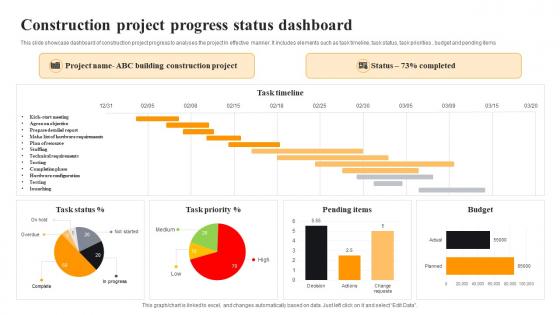
This slide showcase dashboard of construction project progress to analyses the project In effective manner. It includes elements such as task timeline, task status, task priorities , budget and pending items
People who downloaded this PowerPoint presentation also viewed the following :
Construction Project Progress Status Dashboard with all 7 slides:
Use our Construction Project Progress Status Dashboard to effectively help you save your valuable time. They are readymade to fit into any presentation structure.






FAQs for Construction Project
Definitely track your progress percentage and budget vs actual costs first - those are non-negotiables. Schedule variance and any active issues too. Safety incidents and quality scores matter big time, trust me on that one. Resource utilization is huge since you need to know if your team's stretched thin. Change orders and milestone completion rates will save you headaches down the road. Weather delays might be worth adding depending on where you're building. Honestly, the visual stuff makes all the difference - charts and color-coding so problems jump out immediately. Start simple with these basics, then tweak based on what's actually causing you the most grief.
Dude, once you get real-time data feeding into your dashboard, it's like night and day compared to those boring static reports. You'll catch delays and budget issues the moment they pop up instead of finding out hours later when it's too late. Your PMs can actually do something about bottlenecks before they wreck the whole timeline. The system grabs live data from IoT sensors, equipment GPS, field apps – honestly feels like mission control sometimes. Equipment status and labor tracking are usually the best places to start since those hit your bottom line hardest.
Honestly, if people can't figure out your dashboard quickly, they just won't bother using it. I've watched teams completely abandon expensive software because it was too confusing - such a waste. Your interface needs to make sense whether someone's checking it on their phone at the site or pulling up reports back at the office. Field workers especially don't have time to hunt around for basic info. Design it so anyone can jump in and find what they need within 30 seconds, maybe less. Clear layouts matter way more than fancy features that nobody understands.
Honestly, dashboards are a game-changer for this stuff. Everyone can check the same info - budgets, timelines, updates - instead of hunting through endless email threads or playing phone tag with subcontractors. Your clients won't be calling every five minutes asking "what's happening?" because they can just look. The visual layout is clutch since most people don't speak construction fluent, you know? Plus you can set up alerts when deadlines hit or problems come up. Way better than the old "oops, forgot to tell everyone" disasters. Trust me on this one.
Progress bars and Gantt charts are your best friends here - perfect for timelines and showing how much work is actually done. Real-time KPI cards work really well for budget stuff, safety incidents, that kind of thing. Heat maps are surprisingly helpful for spotting where things get stuck across different project phases (I never would've thought of this one initially). Skip pie charts unless it's just basic budget breakdowns - construction data makes them look awful. Site managers are always rushing between meetings and the actual site, so keep everything visual and easy to read quickly.
Dude, get a construction dashboard - it's a game changer. Real-time updates on all your projects so you catch delays early instead of scrambling later. Shows what's behind schedule, what's next, how one delay screws up everything else. Way better than hunting through endless spreadsheets (ugh). Mine pulls data automatically from project tools and makes it visual. Oh, definitely set alerts for critical stuff - you'll get pinged the second something goes sideways with your timeline. Honestly saved my butt so many times when managing multiple sites.
Don't cram everything onto one screen - people will just get overwhelmed and ignore it completely. Vanity metrics are pointless too, like tracking page views when you really need conversion data. Oh, and stale data is the worst - nothing's more annoying than looking at last week's numbers when you're trying to make decisions today. Different people need different things, so what your project manager wants isn't what finance cares about. Honestly, I'd start with maybe 5-7 metrics max. You can always add more later once people actually start using it.
Dude, mobile dashboards are seriously clutch for making calls right on site instead of waiting till you're back at the office. Real-time schedule updates, material tracking, budget stuff - it's all right there when you're doing your walkthrough. Honestly beats the hell out of guessing or working with yesterday's numbers. Last week I caught a delivery issue and fixed it immediately instead of finding out about it three days later like usual. Way faster problem-solving when you've got current data in your pocket. You should definitely try pulling up your dashboard app next time you're out there.
Dude, construction dashboards are game-changers for your budget. You'll catch cost overruns way before they become disasters - instead of finding out weeks later when you're screwed. All your spending gets pulled into one view: labor, materials, equipment, the works. Makes it super easy to see exactly where you're hemorrhaging money. Quick decisions become possible because you're not guessing anymore. Real-time data beats hoping things work out every single time. I mean, who wants to fly blind on a project? The visibility alone will save you thousands.
So you basically pull in all your old project data, weather stuff, and how you've used resources before. The algorithms crunch through everything and spit out forecasts for delays, budget issues, safety problems - honestly gets pretty spot-on after a while. Focus on the big predictors: will you finish on time, budget variance, equipment breaking down. I'd set up alerts when things look sketchy so you can jump on problems early. Way better than just reacting to everything after it hits. Oh, and make sure it sits right next to your live data so you're seeing the whole picture.
Update it every morning - gets everyone on the same page right away. Focus on what actually matters: budget vs actual, schedule progress, safety stuff. Don't go crazy tracking everything or it'll just become another useless report nobody checks. Automate the boring parts like budget pulls and timesheets if you can. Here's the thing though - make one person responsible for updates. Otherwise it turns into that "someone else will do it" situation we've all seen before. Oh, and do a weekly cleanup to dump old widgets that aren't helping anymore.
Honestly, these dashboards are pretty clutch for catching problems early. Instead of hunting through endless spreadsheets (ugh), you get visual alerts when budget's hitting 90% or weather might mess up your concrete pours. Everything's in one spot - cost overruns, delays, safety stuff, resource issues. The automated notifications are what really sold me on them though. Just pick your biggest 3-5 risks first and track the key metrics for those. Way better than finding out you're screwed after it's too late.
Set up automated alerts for permit deadlines and safety inspections - seriously, this beats the hell out of spreadsheets. Your dashboard will show visual indicators when certifications expire, plus you can monitor safety incidents and track subcontractor documentation. Everything's centralized so you're not digging through random emails when inspectors show up (which always happens at the worst times). The automated reminders are clutch during audit season. Honestly wish I'd switched to this setup years ago instead of manually tracking everything like an idiot.
Honestly, getting feedback from users is make-or-break for dashboards. I've watched so many beautiful ones just collect dust because nobody actually found them useful. Survey your different groups separately - field teams want different stuff than executives, obviously. Ask what metrics they actually care about and which views confuse them. Then tweak things based on their input. Sometimes it's tiny changes like moving widgets around or switching up colors that get people to start using it regularly. Oh and don't just build it in a vacuum - that never works out well.
Dude, construction dashboards are getting insane right now. AI's predicting delays before they even happen, which honestly saves so much headache. IoT sensors track literally everything - equipment, weather, you name it. Drones are probably the coolest part though, automatically updating timelines with aerial shots. AR/VR stuff is starting to show up but it's still pretty expensive for most crews. Mobile design isn't optional anymore since everyone's always on-site. But here's the real game-changer - dashboards that pull from multiple sources automatically. That's where you'll actually see your productivity jump. Way better than manually updating spreadsheets all day.
-
Visually stunning presentation, love the content.
-
Great templates that you can use in your next keynote or conference. They are perfect for quick and visually-engaging delivery.