

Project Management And Implementation Status Dashboard




Try Before you Buy Download Free Sample Product
 Impress Your
 Audience
 100%
100% Editable
 Save Hours
 of Time


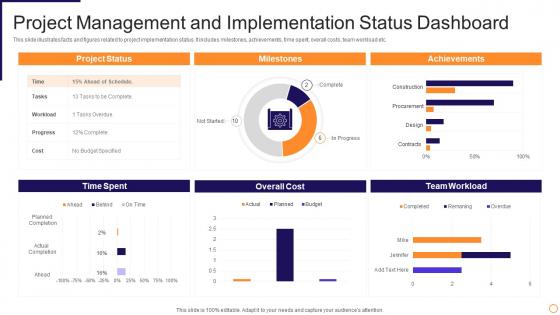
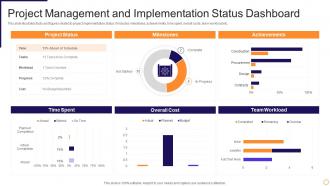
This slide illustrates facts and figures related to project implementation status. It includes milestones, achievements, time spent, overall costs, team workload etc.
People who downloaded this PowerPoint presentation also viewed the following :
Project Management And Implementation Status Dashboard with all 7 slides:
Use our Project Management And Implementation Status Dashboard to effectively help you save your valuable time. They are readymade to fit into any presentation structure.





FAQs for Project Management And
Honestly, just focus on what'll actually help you catch problems early. Timeline stuff and budget vs spend are obvious ones. Task completion rates too - super helpful. Resource allocation is huge because you don't want half your team buried while others are basically doing nothing (learned that one the hard way). Risk indicators are clutch for staying ahead of disasters. If stakeholder satisfaction matters for your project, track that. Quality metrics depend on what you're building. Keep it visual though - nobody wants to stare at spreadsheets. Start with maybe 6 key things and only add more if you're genuinely using them to make calls.
Look, visualization tools are game-changers - they turn those nightmare spreadsheets into stuff you can actually make sense of. Bar charts showing budget vs what you've actually spent? Lifesaver. Timeline visuals for scheduling too. Instead of squinting at endless rows wondering if you're screwed, you get dashboards that show project health instantly. I swear it's like switching from reading instructions to watching someone do it. You'll catch problems way faster when everything's color-coded and visual. My boss actually understands our reports now, which is honestly miraculous.
Ugh, the hardest part is definitely information overload. Everyone wants to see ALL their metrics at once, which just turns your dashboard into a hot mess. Then you're stuck trying to make executives happy (they want the 30,000 foot view) while also giving team members the nitty-gritty details they actually need. It's weird how differently people define "project health" too. Honestly? Start small with maybe 3-5 metrics that people actually use to make decisions. Don't try to be everything to everyone right away. Build separate views for different types of users instead of cramming everything onto one screen - trust me on this one.
Dude, real-time data completely changes the game for project dashboards. Instead of finding out about problems after they've already blown up, you'll catch budget issues and delays while you can actually do something about it. I swear, going back to weekly status reports feels like using a flip phone. The instant updates help you make faster decisions too - plus stakeholders stop bugging you for constant updates since they can just check the dashboard. Just don't set it to refresh every 30 seconds or you'll drive yourself crazy watching it.
Throw a feedback widget directly in your dashboard - seriously, people won't bother if it's complicated. Quick surveys after sessions work great too. User interviews are solid but honestly, just watching which features actually get clicked tells you a ton. Support tickets are goldmines for spotting problems. The real trick though? Actually fix stuff and tell people "hey, we changed this because you asked." Otherwise what's the point. I'd say pick one small thing to improve each sprint. That way you're always moving forward without your dev team wanting to murder you.
Pick 5-7 KPIs max that actually connect to what success looks like for your project. More than that and everyone zones out in meetings. Mix leading indicators (team velocity, budget burn) with lagging ones (completion %, ROI). Here's the thing though - if a red metric doesn't tell you what action to take, it's basically useless. Your team needs to control these numbers, and they've gotta matter to whoever's writing the checks. Oh, and make sure stakeholders actually care about what you're tracking. Start simple first - you can always get fancy later if needed.
Oh man, these things are total lifesavers. Everyone sees the same info - deadlines, who's doing what, current status. No more "wait, what's happening with X project?" texts every five minutes. You can comment on stuff, tag people, share files right there instead of switching between Slack and email and whatever else. Remote teams especially love them. Plus you'll catch problems early when someone's drowning in tasks or things get stuck. Honestly took our team like a week to get used to it but now we can't work without one. Just make sure permissions are set up right from the start.
Honestly, just pick something your team already knows and run with it. Microsoft Project and Asana are solid for tracking stuff, Trello's great if you want the visual card thing. Monday.com too. I've watched so many teams waste weeks debating tools instead of actually managing their projects lol. Short sentences work. If you need fancy charts later, Tableau or Power BI can pull from whatever you're using. Don't overthink it - you can always switch once you figure out what you actually need vs what sounds cool in demos.
Think about what each group actually does with your updates. Executives just want the big picture - is everything green or are we screwed? Team leads need enough info to catch problems and figure out next moves. Your actual project team wants the nitty-gritty stuff they can work with today. Here's what I've learned works: ask people "what decisions are you gonna make with this?" Most folks never think about it that way. Don't try shoving everything into one giant report - nobody reads those anyway. Build separate views for different people instead. Just focus on your main audience first and get that right.
Honestly, connecting your dashboard to other systems is a game changer. No more copying data between tools like some kind of data entry robot. Real-time syncing means you can see how projects affect your budget and sales without opening ten different apps. Your team will thank you for killing all that duplicate work - I swear half my day used to be updating the same info everywhere. Start with your CRM or accounting software since those are probably your biggest pain points. Once everything talks to each other, you'll actually trust your data for decisions.
So basically you'll want different views for different people. Executives just care about the big picture - budget, timeline, major milestones. Don't overwhelm them with every tiny detail. Your team needs the nitty-gritty stuff though - who's doing what, when it's due, what resources they have. Clients? Give them progress updates and delivery dates, but honestly they don't need to see all our internal messiness. Most tools have role-based permissions built in. Oh, and here's what really works - just ask each group what they actually need to make decisions. Saves so much back-and-forth later.
Check who actually needs to see your dashboard first - you don't want budget details getting to random people. Set up different permissions for different folks. Executives can see the big picture stuff while team leads get the nitty-gritty operational details. If you're sharing outside the company, definitely strip out internal comments and confidential metrics beforehand. Oh, and create some kind of sharing checklist so you don't accidentally expose something sensitive. I learned that one the hard way - nothing worse than realizing you shared too much after hitting send.
Look, dashboards are honestly game-changers for catching problems early. Set up alerts for budget issues, missed deadlines, that sort of thing - saves you from nasty surprises later. The visual stuff makes spotting patterns way easier than staring at spreadsheets all day (trust me on this one). You can actually track whether your backup plans are doing anything useful too. My advice? Pick your top 3-5 things that usually go wrong and monitor those constantly. It's not perfect but beats flying blind.
Honestly, mobile dashboards are a game changer. You can catch issues the second they pop up instead of waiting until you're back at your desk – and trust me, stakeholders love getting updates that fast. Everyone stays in the loop no matter where they are. The trick is finding a platform that's actually built for mobile, not just something that technically works on your phone. Those tiny buttons and squished charts are useless. You want something you can actually navigate without zooming in every two seconds. Real-time access means faster decisions, which is pretty much everything in project management.
Honestly, focus on whether people are actually using it first - like daily logins and active users. Then check if it's making a real difference: projects hitting deadlines more, faster decisions, less time wasted in those endless status meetings we all hate. I'd also throw in some user feedback surveys, though people's moods totally affect those responses. The best sign? When your team starts catching problems early instead of scrambling at the last minute. Oh, and measure this stuff right away - within a month - so you can fix things that aren't working.
-
“Love it! I was able to grab an exciting proposal because of SlideTeam.”
-
Delighted to see unique and eye-catching PowerPoint designs that are so easy to customize.