


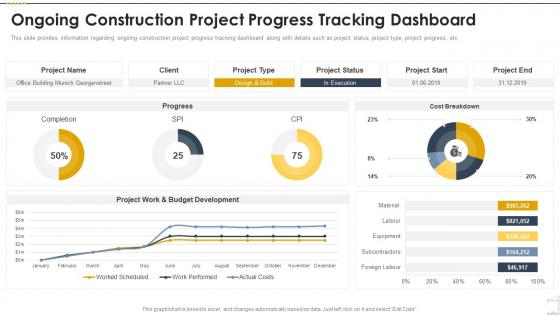
Ongoing Construction Project Progress Tracking Dashboard Construction Playbook




Try Before you Buy Download Free Sample Product
 Impress Your
 Audience
 100%
100% Editable
 Save Hours
 of Time


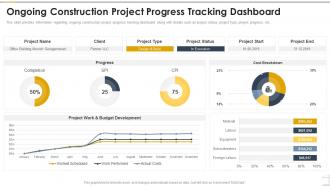
This slide provides information regarding ongoing construction project progress tracking dashboard along with details such as project status, project type, project progress, etc.
People who downloaded this PowerPoint presentation also viewed the following :
Ongoing Construction Project Progress Tracking Dashboard Construction Playbook with all 7 slides:
Use our Ongoing Construction Project Progress Tracking Dashboard Construction Playbook to effectively help you save your valuable time. They are readymade to fit into any presentation structure.





FAQs for Ongoing Construction Project Progress Tracking
Start with schedule performance - everyone's always breathing down your neck about that one. Budget vs actual costs is obvious but critical. Safety incidents and quality stuff like rework percentages matter too. Resource utilization and labor productivity are huge since they mess with both timeline and budget. Oh, and milestone completion rates plus change order status because those topics never fail to dominate meetings. Weather delays might seem minor but they add up fast. Permit approvals too if they're slowing you down. Honestly, begin with these basics and build from there based on what your stakeholders actually obsess over.
So basically, these dashboards show you exactly where your project sits compared to your original timeline. You'll spot which tasks are cruising along fine versus the ones that are totally behind schedule. The visual stuff is pretty cool - shows how everything connects, like if your foundation gets delayed, you'll see it mess up the framing timeline too. I always set mine to ping me about a week before big deadlines hit. That way you're not scrambling last minute to move crews around or speed things up. Honestly beats the hell out of trying to track everything in your head.
Waterfall charts are honestly the best thing for budget tracking - they show your planned budget flowing down through actual costs so overruns jump out immediately. I always color-code variance percentages red/green by project phase too. Bullet charts work great for quick health checks. Trend lines help you see spending velocity over time, which is clutch when things start going off the rails. The trick is layering everything so you can zoom from high-level budget status down to specific line items when stuff gets messy.
So instead of constantly updating spreadsheets (seriously, such a time suck), real-time integration pulls data automatically from all your sources - sensors, worker updates, deliveries, budget stuff. Your dashboard becomes this live command center rather than some static snapshot from last Tuesday. You'll catch problems way earlier, like delays before they spiral or budget issues creeping up. Makes decisions way easier when you're working with current info, not old data. Oh, and definitely start with whatever's causing you the biggest headaches right now - those systems should connect first.
Honestly, if your dashboard is confusing, nobody's gonna use it. Construction crews are already swamped with deadlines and don't want to fight some messy interface just to see where things stand. Clean design = people actually adopt it and update their data. I've literally watched teams ignore beautiful dashboards because they were impossible to figure out - such a waste. Make your key numbers pop right away. Test it with real users first, not just whoever built it. Simple beats fancy every time.
Dude, these dashboards are game-changers. Everyone sees the same live updates - timelines, budget, issues, whatever. No more endless email threads or phone tag bullshit. Your owners, contractors, and subs are all looking at identical data, so you avoid those awkward "wait, I thought we agreed on..." conversations. Honestly, it's like giving your whole team telepathy or something. Set up alerts for the big milestones so people only get bothered when stuff actually affects them. Way better than the old-school chaos most sites run on.
Honestly, most teams screw this up by using estimates instead of real data. Get your project manager (or whoever's most reliable) to update it daily at the same time - makes it way more consistent. Focus on the stuff that actually moves the needle: budget variance, schedule, critical milestones. I've watched too many dashboards turn into complete messes with random metrics nobody cares about. Your team needs easy access and should know how to read the important stuff. Oh, and definitely set up alerts for big problems - you don't want things sliding by unnoticed.
Honestly, dashboards are game-changers for catching problems early. Set up alerts for budget overruns, delays, safety issues - whatever could mess up your project. The visual stuff makes spotting patterns way easier too. Like maybe you'll notice one subcontractor is always behind, or rain consistently screws your timeline. Track which fixes actually work while you're at it. Oh, and definitely automate notifications for your worst nightmare scenarios. Trust me, you don't want to be manually checking everything constantly - that gets old fast.
Honestly, I'd start with Procore if you haven't tried it yet - their dashboard templates are really solid. Buildertrend and PlanGrid are also worth checking out since they're pretty much what everyone uses. If you're trying to save money though, you could totally build something custom with Power BI or Tableau. I've actually seen some teams do cool stuff with just Microsoft Project and Excel dashboards (sounds basic but it works). The main thing is picking something that connects to your current systems automatically. Manual data entry is such a pain and nobody keeps up with it.
Yeah, it's all about what your project stakeholders actually care about. Residential? You're watching unit completions, inspections, buyer walkthroughs - pretty straightforward stuff. Commercial gets messier with tenant fit-outs and zoning compliance. Don't even get me started on permit tracking - that's where projects go to die sometimes. Infrastructure's a whole different beast though. Environmental monitoring, utility moves, plus you've got to keep the community happy or they'll shut you down. Honestly, I'd just figure out what's gonna stress out your project sponsors the most and build your dashboard around that instead of generic construction metrics.
Biggest mistake? Cramming everything onto one screen. Users get overwhelmed when they can't quickly spot the important stuff - budget issues, timeline problems, safety incidents. Generic KPIs are pretty useless too. Like, who cares about "percent complete" if you can't see WHY you're behind? That's just annoying. Your data needs to be current because old info is actually worse than nothing. Oh, and focus on what project managers need day-to-day, not flashy metrics that just impress executives. They're the ones actually using this thing every day.
Dude, mobile access for construction dashboards is seriously clutch. You're on-site and boom - blueprints, delivery updates, task changes, all right there on your phone. No more hiking back to the trailer constantly (my steps were ridiculous before). Real-time updates keep everyone on the same page, plus you catch problems early instead of expensive fixes later. The whole team stays connected way better. Honestly? Try using your dashboard app in the field tomorrow and see what I mean. It's like having your office wherever you need it.
Honestly, dashboards are game-changers for compliance stuff. Instead of drowning in spreadsheets, you can track everything in one spot - safety incidents, environmental data, permits, inspections, the works. Real-time monitoring means you're not flying blind anymore. When audit season hits (ugh), you'll actually have your documentation organized and ready to go. The automated alerts are clutch too - they'll ping you before deadlines so you're not pulling all-nighters trying to meet some random EPA requirement. Just make sure your main KPIs are front and center so everyone knows where you stand.
So I've been digging through old project data lately and wow - the patterns are wild when you actually see them. Filter your past projects by size and type first, then look at where you always blow deadlines or go over budget. Like, I bet your exterior stuff gets wrecked by weather every winter, right? Also check which subs actually show up when they say they will. Takes maybe an hour but you'll have way better estimates for your next bid. Way better than just guessing and hoping for the best.
User roles control who sees what on the dashboard - pretty straightforward stuff. Project managers get the full picture with budgets and timelines. Field supervisors only see their task lists and safety data. Contractors? They're locked down to just their work packages, which honestly makes sense since you don't want them poking around financial info. Role templates are super handy - they auto-apply permissions when you add people. One thing though: audit those permissions every few months. Projects change fast and suddenly your intern has budget access while your new PM can't see anything. Learned that one the hard way.
-
Best Representation of topics, really appreciable.
-
Good research work and creative work done on every template.