Imagine driving an excellent car with a lit-up dashboard showing your speed, fuel, and engine warnings. Now, think about how dull the journey would be without this dashboard magic, leaving you clueless about your journey.
A business dashboard acts like a control center that provides feedback on how well the company is doing. It’s like a real-time snapshot of the team’s performance and the company’s health. It helps organizations become more efficient, productive, and profitable, while avoiding mistakes.
What’s an Organizational Dashboard?
It is a tool that gathers and displays information about a business in one place. It helps managers and employees track KPIs and use intelligent data to make decisions.
Why should we use Organizational Dashboard template?
Organizations use data-driven goals and metrics in templates to identify issues, reduce costs, and surpass expectations. Industries use dashboard PPT Templates to enhance business processes, including healthcare, HR, marketing, sales, logistics, and IT.
SlideTeam offers PowerPoint Templates for tracking, analyzing, and achieving organizational goals, providing trends and opportunities that traditional reports may miss.
Explore efficiency-boosting capabilities with a download of our Operational Dashboard Templates.
Each of these templates is 100% customizable and editable. With pre-designed slides and editable content, you can tailor the presentation to suit specific audience profiles.
Let’s begin!
Template 1 Organizational Dashboard KPI for Recruitment with Cost of Hiring
Are you searching for a presentation template incorporating Recruiting Key Performance Indicators (KPIs) to gauge your hiring process’s efficiency? This PPT Template provides insights into your progress toward achieving recruiting goals, in making strategic decisions on time and budget allocation. Implement this dashboard, which outlines total applicants, shortlisted candidates, hired candidates, and rejected candidates over time, along with the cost of hires, to help organizations monitor recruitment process. This template gives businesses department-wise vacancies, application sources, recruitment funnel, etc.
Template 2 KPI Dashboard of Organizational Headcount Comparison
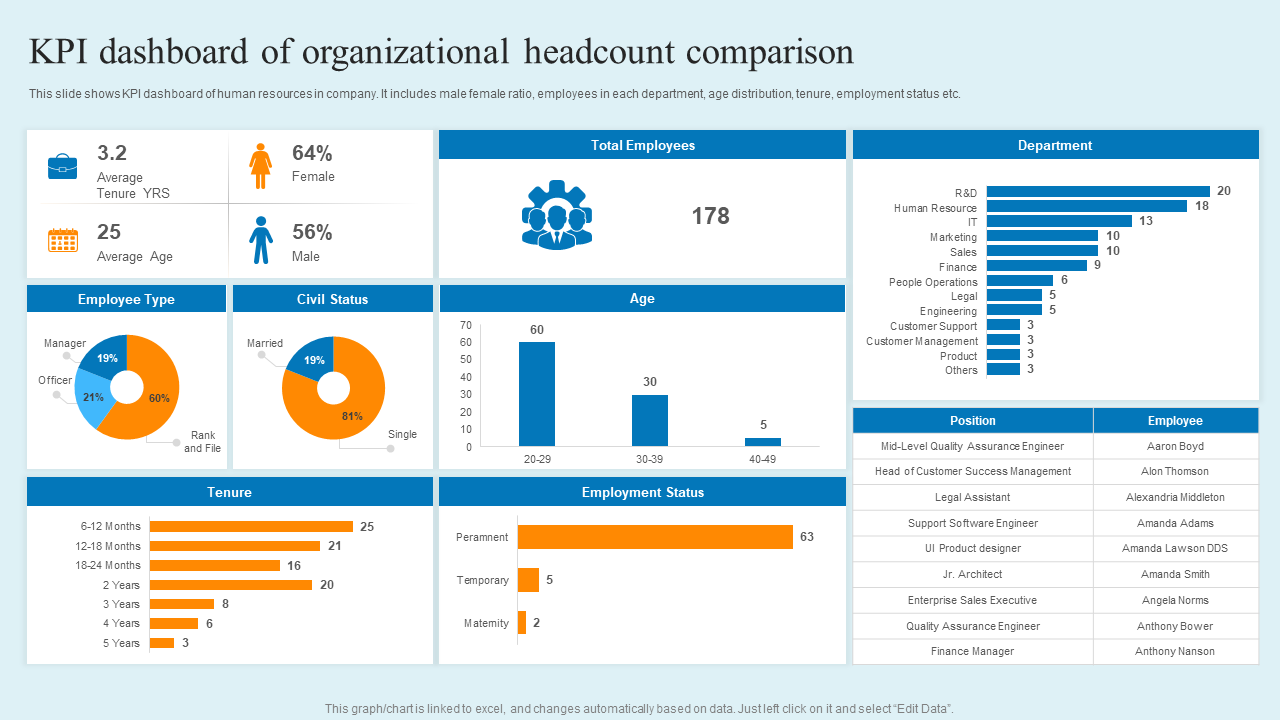
This presentation template is a powerful tool for managing headcount complexities in a PPT Template format. It enables confident decision-making aligned with organizational goals, focusing on male-female ratio, departmental headcounts, age distribution, and tenure. The dashboard provides insights into workforce composition, resource allocation, and employment status. The ability to depict individual positions within jobs offers a view of organizational leaders. Download now for taking calculated risk, promoting diversity, and enhancing productivity.
Template 3 Organizational Inventory Ratio Management Dashboard
Deploying this presentation template enables attention to shift to organizational aspects that offer insights into inventory status and managerial tasks. It features KPIs such as available and reorder items, shipping status, and total quantity. Integrate financial metrics such as inventory value, average net profit, and received/ordered amounts. A vertical bar graph represents a quantity in versus out, while the pie-chart shows the final available quantity as a percentage. The dashboard provides a comprehensive overview, facilitating quick assessments and informed decisions. Download now for efficient inventory management and financial analysis.
Template 4 Internal Organizational Communication Dashboard with Channels
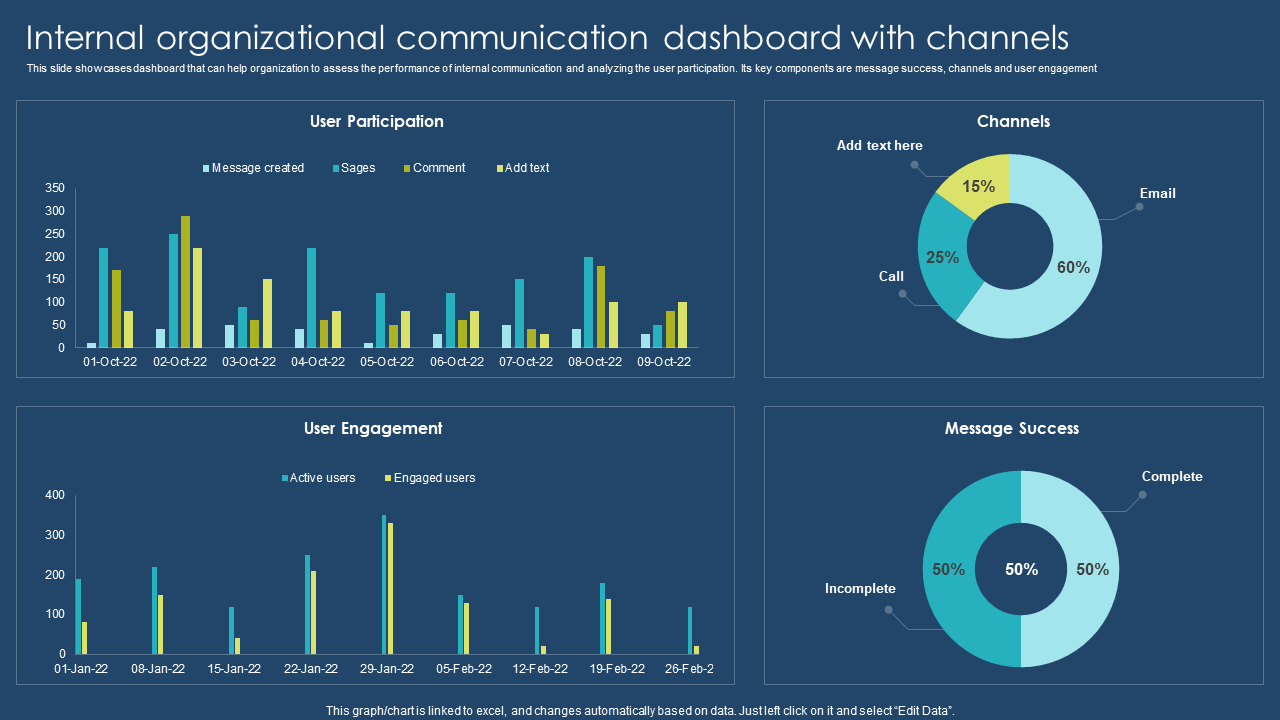
Searching for a presentation template that acts as an apt instrument for evaluating and enhancing internal communication performance in an organization. It acts as centralized hub, combining channels to facilitate interaction among team members, departments, and leadership. A vertical graph details user involvement by date, reflecting the status of message creation, stages, and comments. A pie-chart categorizes message success as complete or incomplete, distinguishing between email and call channels. The template, essential for fostering collaboration, innovation, and well-informed decision-making, is crucial for a communication dashboard with channels. Download now for creating and maintaining effective communication within the workplace!
Template 5 KPI Dashboard of Organizational Finance Metrics
This PPT Template is designed to streamline the analysis of a company's financial status—track income, expenses, accounts, and liquidity ratios for an overview of financial transactions. Crucial metrics like budget adherence, net profit, and percentage profit margin empower decision-makers with strategic insights for sustainable growth. This ready-made PPT ensures transparency and clarity in assessing the organization’s fiscal performance, condensing complex financial data into actionable insights. It’s an indispensable resource for informed decision-making and long-term financial planning.
Template 6 Dashboard to Track Organizational Cash Flow Management Position
Everybody is aware that cash is an organization’s lifeblood, ensuring its survival and operational efficiency? This template allows businesses to manage cash flow, meet payment deadlines, avoid debt, and enhance solvency. The template facilitates cash flow trends, incorporating graphs for revenue, Gross Margin, EBITDA, Working Capital, CAPEX, and Free Cash Flow. Key financial elements, including revenue, costs of goods sold, operating expenses, capital expenses, and cash flow activities, are presented in table form with fields such as actual, budget, deviation, and % deviation or variation. Use this PPT Template to enable effective monitoring and strategic decision-making in financial management.
Template 7 Project Management Dashboard Showing Organizational Progress
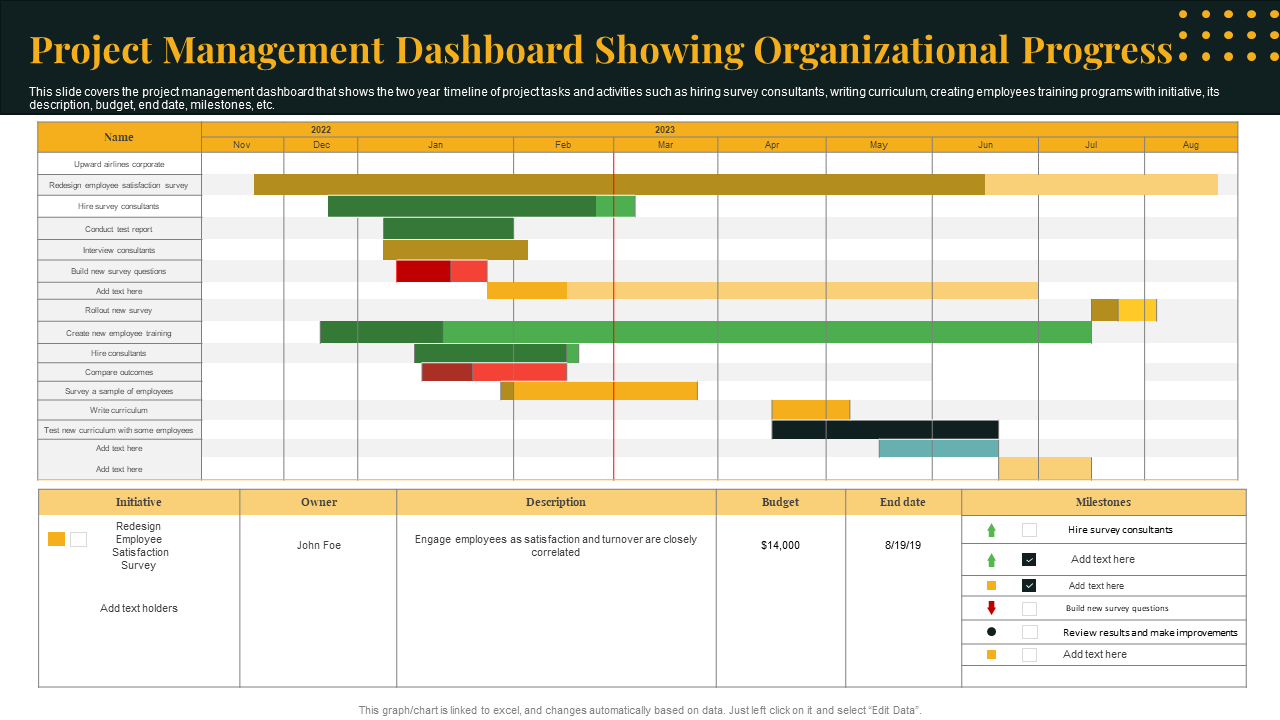
This PowerPoint Template offers an overview of a two-year project, from start to completion. The slide uses a horizontal bar chart to outline each activity, with its name and start and end points. The activities involved include redesigning a survey, hiring consultants, conducting tests and interviews, formulating new questions, survey rollout, outcome comparison, employee sampling, and curriculum writing. Depict initiatives along with their owner, description, budget, and end date. Track milestone statuses using checkboxes. Deploying this template is the best way to create and update timelines. Get this major aid for your business now!
Template 8 Organizational Catastrophe Dashboard
on Tackling Risk Together
How can you monitor and manage potential crises within your company? This template offers the solution, addressing aspects of organizational risk and facilitating quick, informed decision-making for at-risk employees during the coronavirus pandemic. The template presents information, including confirmed cases, the total number of employees, those at risk, and their respective risk percentages. It features a horizontal chart illustrating employees at risk by the office (A to E), correlating with the number of employees, while a vertical chart breaks down age-wise distribution. The template includes a cases map, highlighting at-risk employees and province-wise results for those at risk.
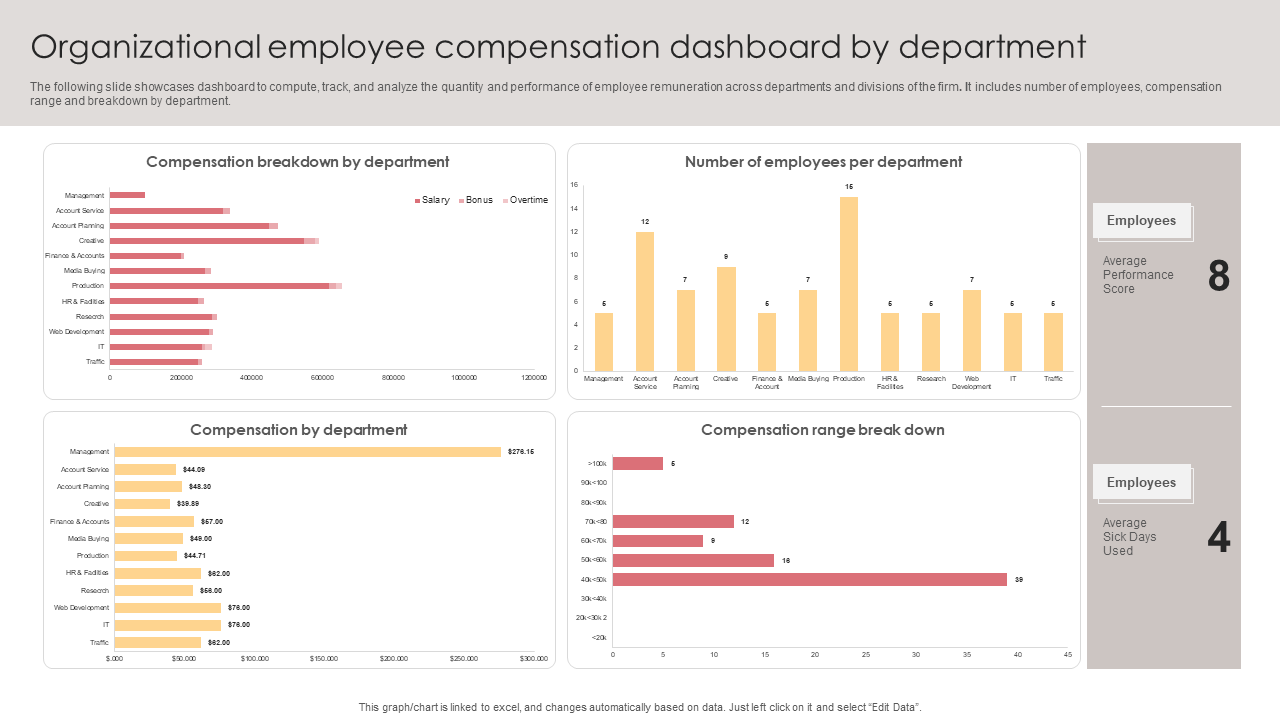
Template 9 Organizational Employee Compensation Dashboard by Department PPT Presentation
Presenting a PPT template for efficient compensation data management and analysis. This template empowers computation, tracking, and analysis of employee remuneration across departments and divisions. Key metrics include a department-wise breakdown of compensation, encompassing salary, bonus, and overtime figures. The slide provides insights into the number of employees across departments such as Account Service, Finance Account, HR & Facilities, and Research, along with a compensation range breakdown. Visual representation through horizontal and vertical bar charts enhances clarity. Additionally, the template includes average performance scores and sick days used, offering compensation and performance metrics in the required format.
Template 10 Dashboard for Tracking Organizational OGSM Metrics
Last but not the least, this PowerPoint Template features a comprehensive dashboard that aids in translating your corporate vision or strategy into actionable steps. This template allows you to delineate organizational, team, or personal goals, transforming ideas into tangible activities by assessing company OGSM metrics. It showcases vital metrics like Objectives, Goals, Strategies, Measures, and Initiatives through pie charts, using indicators such as on track, at risk, off track, on hold, and completed. Additionally, the template facilitates highlighting information about revenue, market share, initiatives, and gross margins. It serves as a tool for visualizing and implementing strategic plans.
Proactive Insights
Organizational Dashboard PowerPoint Templates facilitate the proactive identification of internal issues before these escalate into significant errors costs. With careful monitoring of your business’s overall health and individual and team assessments, you enhance the likelihood of early detection of adverse trends or problems. It allows for prompt intervention, preventing potentially costly mistakes within your company. Gain real-time insights and track project progress effortlessly from our Project Status Dashboard Templates with a click here.
PS Navigate through insights and streamline your change management process with our Must-Have Change Management Dashboard.




 Customer Reviews








![BEST Slides on AIOps Guide: Automating IT Operations [With FREE PPT & PDF]](https://www.slideteam.net/wp/wp-content/uploads/2023/10/BANNER-2-1-1013x441.png)


