


Transport Management Dashboard For Logistics Company With Fleet Status




Try Before you Buy Download Free Sample Product
 Impress Your
 Audience
 100%
100% Editable
 Save Hours
 of Time


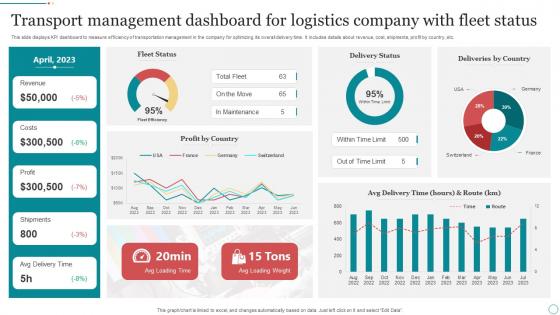
This slide displays KPI dashboard to measure efficiency of transportation management in the company for optimizing its overall delivery time. It includes details about revenue, cost, shipments, profit by country, etc.
People who downloaded this PowerPoint presentation also viewed the following :
Transport Management Dashboard For Logistics Company With Fleet Status with all 7 slides:
Use our Transport Management Dashboard For Logistics Company With Fleet Status to effectively help you save your valuable time. They are readymade to fit into any presentation structure.





FAQs for Transport Management Dashboard For Logistics Company
Honestly, just pick the ones that actually matter for your business. On-time delivery rates are huge - customers notice when stuff's late. Track your cost per mile and fuel efficiency too, those add up fast. I'd also watch vehicle utilization and how your drivers are performing, especially if you've got multiple trucks running. Don't sleep on customer satisfaction scores either, they're way more telling than most people realize. Maintenance costs and route optimization should be on there too. But seriously, cap it at like 6-8 metrics or you'll drown in spreadsheets. Pick what ties directly to making money and update them consistently.
Look, real-time data basically turns your transport dashboard into mission control instead of some boring static report. Everything updates live - where your vehicles are, traffic jams, delivery status, route changes. Super helpful because you can actually fix problems as they happen rather than finding out hours later when it's too late. Need to reroute around an accident? Done. Customer wondering about their delay? You already know. Honestly the trick is just making sure your data feeds update fast enough to be useful - some systems are still pretty slow at pushing updates.
UX can make or break transport dashboards. Your operators are dealing with split-second calls under crazy pressure - if they're hunting around for info or clicking through tons of screens just to dispatch a vehicle, you've already lost. Make it simple enough that someone brand new could figure it out fast. Nobody's got weeks to train when there's a bus full of annoyed passengers stranded somewhere. Clear visual setup, don't overload their brains with clutter. Honestly, the best move? Test with real dispatchers early and often. They'll tell you exactly what sucks before you waste time on something that looks nice but totally fails when it matters.
So predictive analytics is like having a heads up for all your transport stuff. You'll catch delays, capacity problems, and maintenance issues way before they hit. Trust me, it beats scrambling to fix everything last minute. The tech looks at your past data, weather, traffic patterns - all that - to predict what's coming in the next few weeks. Then you can switch routes early, plan maintenance when trucks aren't busy, stuff like that. Honestly I'd start with whatever route gives you the most headaches regularly.
Line charts work best for tracking delivery times and fuel usage over time. Heat maps are clutch for route density and congestion spots. Bar charts? Perfect for comparing vehicle performance. Geographic maps are obviously a must for fleet tracking and spotting problem areas. Just don't go crazy with too many visuals - I've seen dashboards that look like someone threw data at a wall. Keep it focused on your main KPIs first. Really depends what decisions you're trying to make though. Match the chart to the question you're asking.
So transport dashboards are basically your compliance lifesaver. They track all the regulatory stuff automatically - driver hours, vehicle inspections, safety scores, environmental data. Real-time monitoring means you're not scrambling when auditors show up (honestly the worst feeling ever). Reports get generated without you lifting a finger, plus it'll flag violations before they bite you. My advice? Figure out which regulations mess with your operations most, then set up monitoring for those first. The paperwork headache alone makes it worth it. Everything's in one spot instead of scattered across different systems.
Honestly, the two biggest headaches are getting all your data to play nice together and dealing with pushback from your team. All that transport stuff - GPS, fuel cards, maintenance logs - it's usually spread across different systems that hate talking to each other. Drivers especially can be stubborn about new tech if they've been doing things the same way forever. Bad data going in means useless info coming out, which is obvious but worth mentioning. I'd start super simple - pick one or two metrics that matter most, nail those first. Once people see it actually helps, you can slowly add more bells and whistles.
Honestly, mobile accessibility can totally make or break your transport dashboard. Your drivers and dispatchers need real-time data on their phones - otherwise they're working blind when stuff hits the fan. Push notifications actually get seen, unlike emails that sit there forever. Route changes, traffic delays, all that chaos happens fast and your team needs info instantly. I'd definitely test your current setup on different phones first though - you might be surprised how broken it looks on mobile. Oh, and make sure the buttons are actually big enough to tap while someone's in a truck cab!
Man, IoT totally changed everything for transport dashboards. Before you'd get these clunky batch updates, now it's all real-time streams. Sensors pump in vehicle locations, fuel data, engine diagnostics - even what's happening with your cargo. Pretty crazy stuff. Your dashboard shows live fleet status and can actually predict when trucks need maintenance before they break down. Route efficiency becomes way more visible too. Only catch is you're drowning in data now, so your system better handle all that info without falling over. Worth it though.
So basically these dashboards show you everything happening with your fleet in real-time, which is huge for cutting costs. You'll catch problems right away instead of finding out weeks later when it's too late. Route optimization becomes way easier - you can see where all your trucks are and match them with available loads to cut down on empty miles. Fuel savings add up quick too. Driver performance tracking helps, though honestly some drivers hate being monitored that closely. The trick is setting up alerts for the stuff that actually impacts your budget, otherwise you'll just drown in data.
Start with real-time tracking - you gotta know where your vehicles and drivers are. Fuel analytics will save you a ridiculous amount of money, trust me on that one. Route optimization is clutch for cutting delivery times and gas costs. Maintenance scheduling prevents those expensive breakdowns that always happen at the worst possible moment. Oh, and definitely get incident reporting set up so you can spot problems fast. Compliance monitoring too, obviously. Build these out first, then see what your team actually needs day-to-day before adding more bells and whistles.
Dude, these dashboards are honestly a lifesaver. Everyone sees the same real-time info instead of that annoying game of telephone where drivers call dispatchers who email customers and so on. No more "wait, I thought you knew about the delay" drama. You'll get automatic alerts when stuff goes sideways, plus visual updates that actually make sense. The shared data thing is huge - like, why did we ever think scattered communication was okay? Just set different viewing permissions for whoever needs access and boom, way less confusion. Seriously cuts down on all those miscommunication headaches.
Check out UPS's ORION system first - it's honestly insane how they optimize routes in real-time and save millions. FedEx has this SenseAware thing that tracks everything (temp, humidity, location). For public transit, Transport for London's dashboard is pretty brilliant. You can actually mess around with it since it's public - shows live tube delays and stuff. Convoy does freight management too if that's your thing. I'd definitely start with the TfL one though, you'll get a feel for how route planning should work without having to sign up for anything.
So ML basically turns your transport dashboard into something that actually predicts stuff instead of just showing what already happened. You can forecast demand spikes, catch maintenance issues before trucks break down, and optimize routes using live traffic data. It learns from your old data to spot patterns you'd miss completely. Plus it automatically flags weird things like sudden fuel spikes or delays. Honestly, route optimization is probably your best starting point since you'll see results fast. Oh, and maintenance scheduling too - that's where most companies get instant payback.
Different roles need totally different dashboards, so go role-based. Fleet managers want real-time vehicle tracking and route optimization up front. Dispatchers need order status and delivery scheduling - stuff that keeps things moving. Finance folks care about cost analytics and fuel spend tracking. Honestly, the widget arrangement thing is huge - let people hide what they don't use and move things around. I'd start by figuring out what each person actually does all day, then just build around that. Makes way more sense than giving everyone the same generic view.
-
Awesome presentation, really professional and easy to edit.
-
It saves your time and decrease your efforts in half.