


Fleet Management System KPI Dashboard




Try Before you Buy Download Free Sample Product
 Impress Your
 Audience
 100%
100% Editable
 Save Hours
 of Time


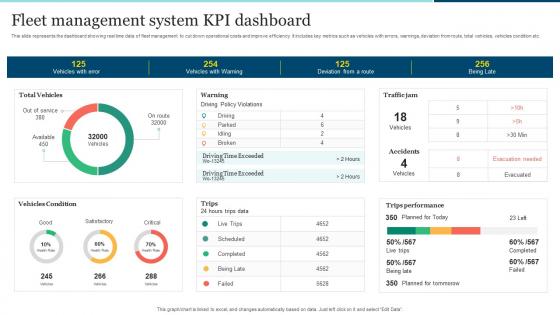
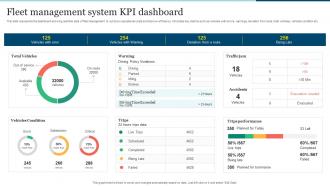
This slide represents the dashboard showing real time data of fleet management to cut down operational costs and improve efficiency. It includes key metrics such as vehicles with errors, warnings, deviation from route, total vehicles, vehicles condition etc.
People who downloaded this PowerPoint presentation also viewed the following :
Fleet Management System KPI Dashboard with all 7 slides:
Use our Fleet Management System KPI Dashboard to effectively help you save your valuable time. They are readymade to fit into any presentation structure.





FAQs for Fleet Management
Track fuel cost per mile and MPG first - those'll show you exactly where you're bleeding money. Driver behavior is massive too. Aggressive driving kills efficiency by like 15-40%, so watch for harsh acceleration and speeding. Idle time is honestly your easiest fix since drivers love letting trucks run during breaks (I get it, but still). Route optimization scores matter, plus vehicle utilization rates. Set benchmarks for everything, then go after your worst performers first. Oh, and idle time percentage - did I mention that already? Start there.
Track your idle time percentage and daily idle hours per vehicle - plus how much fuel you're burning just sitting there. Your fleet management system should pull this stuff automatically. Honestly, get your baseline numbers first because you'll probably be pretty surprised at the waste. Keep idle time under 10% if you can. Then figure out which drivers are the worst offenders and coach them up. The route planning thing makes a huge difference too - less stop-and-go means way less idling time overall.
Okay so maintenance KPIs are honestly like having a crystal ball for your fleet. Track things like how often you're actually completing scheduled maintenance (aim for 95%+), mean time between failures, and cost per mile. Short story - it's way cheaper to catch issues early than deal with a total breakdown on the highway at 2am. Think of it like regular doctor visits vs emergency surgery, you know? The data helps you time everything perfectly so vehicles last way longer. Most fleets I've seen that ignore their PM completion rates end up replacing trucks years earlier than they should. Start there and you'll see the difference pretty quick.
Honestly, start with safety stuff - accident rates, hard braking, speeding incidents per driver. That's your bread and butter right there. Fuel efficiency is clutch too because some drivers just can't help themselves with the gas pedal lol. Track on-time deliveries, vehicle inspection compliance, and hours violations. The real game-changer though? Setting up automated reports so you're not stuck manually pulling data every week. Focus on safety and fuel economy first - those two will tell you everything you need for actual coaching conversations with your drivers.
Definitely start with vehicle utilization rates and fuel efficiency per mile - those are your bread and butter metrics. Maintenance costs per vehicle matter too, obviously. Driver productivity is big (deliveries per hour and stuff like that). Fleet uptime might be the most critical one though - how much time your trucks are actually on the road vs sitting around broken or whatever. Route optimization effectiveness and total cost per mile give you the bigger picture. Oh, and repair turnaround time kills profits if it's too long. Start there, then add more specific tracking once you figure out your biggest pain points.
So here's the thing - KPIs help you catch safety problems before they blow up. Track stuff like harsh braking, speeding, overdue maintenance, driver fatigue scores. That way you can spot the sketchy patterns early. Compliance gets so much easier too when you're watching inspection schedules and license renewals in real-time. No more panic mode when auditors roll up! Just make sure you set up automated alerts - otherwise you're just hoarding useless data. Honestly, I'd start with maybe 3-4 key safety metrics instead of going overboard right away.
So basically you just add up everything - purchase price, insurance, gas, maintenance, all that stuff over the vehicle's whole life. Then divide by months or miles to get your per-period cost. Honestly the tracking part sucks at first but it's super worth it. I'd start with maybe 2-3 vehicles and do it manually before building some spreadsheet system. Most people I know update theirs quarterly since fuel prices are all over the place. Don't forget weird costs like registration fees and driver wages - they add up fast. Once you get the hang of it you can automate most of it through fleet software.
Honestly, tracking utilization rates is a game-changer for spotting money drains. Shows you which vehicles are actually working vs just sitting there doing nothing. I know a company that discovered they had like 30% more trucks than needed - crazy expensive mistake. You can sell off the deadweight or reassign underused ones to busier routes. Plus when you need new vehicles, the data backs up your case instead of just guessing. Track daily percentages for each one. Routes get way easier to optimize too since you'll see exactly where there's extra capacity. Trust me, most people are shocked by what the numbers reveal.
So basically, all that manual tracking you're doing? GPS telematics and fleet software can automate it. You'll get real-time data on fuel use, how your drivers are performing, vehicle health - the whole deal. No more messy spreadsheets! The analytics will catch patterns you'd never notice, like which routes are fuel hogs or who needs safety training. Honestly, the automated dashboards alone make reporting so much easier. I'd start by figuring out what's driving you crazy with your current system, then find tech that fixes those specific problems first.
Honestly, I'd focus on miles per gallon and delivery time variance first - those two will show you the most. Route completion rate matters too, obviously. Cost per mile is clutch but everyone obsesses over fuel costs and totally ignores driver utilization, which is actually huge. On-time delivery percentage speaks for itself. Oh, and track stops per route plus how long drivers are sitting at each location - that dwell time adds up fast. Don't try to monitor everything at once though. Pick maybe 3 that match your biggest headaches, get comfortable with those, then add more later.
Track satisfaction scores and connect them to delivery stuff - on-time rates, how drivers act, vehicle condition. Survey people after deliveries and watch for patterns. If scores tank with certain drivers, dig deeper. The complaint-to-compliment ratio is honestly pretty revealing too. Monthly reviews work well - match satisfaction trends with fleet data, then tweak training based on what you find. Route efficiency and maintenance schedules are good places to start since you can actually control those. Oh, and make sure you're tracking operational metrics you can realistically change, not just random data points.
Look, you've gotta benchmark your fleet KPIs against industry standards or you're basically guessing if your performance is decent or trash. That 15% fuel cost spike? Sounds horrible until you find out everyone else is dealing with 22%. Industry reports help you figure out where you're lagging behind and - this part's key - give you actual data when you're asking leadership for more budget. Nobody wants to hear "trust me bro" when you're requesting cash. Your trade association probably publishes benchmarking studies annually, or check what fleet management companies put out. Way better than just making up targets and hoping for the best.
So basically, KPIs show you which drivers are doing what wrong - like who's slamming brakes or speeding constantly. Sarah might always brake hard at intersections, or your night crew keeps having close calls (honestly, night shifts are rough). Instead of boring everyone with generic training, you can target specific problems. The cool thing is you'll actually know if training worked by comparing accident rates before and after. Set up alerts for sketchy driving and you'll catch stuff before it gets expensive. Way better than guessing who needs help.
Honestly, I'd check what your current fleet software can do first - most of them have decent reporting now. Samsara and Verizon Connect both do solid KPI dashboards. If you need something fancier, Tableau's great but kinda pricey. Power BI's cheaper and Google Data Studio is free (though it can be finicky sometimes). For basic stuff, Excel works fine with some pivot tables. The main thing is getting automatic data pulls from your telematics - nobody wants to manually update reports every week. Start simple and upgrade later if needed.
Check your operational stuff monthly - fuel efficiency, driver behavior, that kind of thing. But save the big strategic reviews for quarterly. I swear, some teams go crazy checking everything weekly and it just makes everyone nuts. Monthly keeps you ahead of problems before they get expensive. Once a year, step back and ask if you're even tracking the right metrics anymore. Your business changes, right? So maybe your KPIs should too. Oh, and set actual calendar reminders or you'll forget. The key question: "is this KPI still making people do what we want?" That'll save you.
-
Attractive and useful
-
Requested a complete pitch deck. Delivered immediately and with high quality well researched content.
-
The design is very attractive, informative, and eye-catching, with bold colors that stand out against all the basic presentation templates.