In 2023, the Business Intelligence (BI) market was $29.42 billion, growing at a Compound Annual Growth Rate (CAGR) of 9.1%, and is expected to reach $54.27 billion by 2030. This exceptional growth shows that organizations are more focused on informed and strategic decision-making. A key feature of modern BI solutions is the real-time dashboards that help business transform the way they monitor, analyze, and respond to data.
Real-time dashboards offer a diligent and interactive way to visualize data as it is generated and processed. This feature lets decision-makers track key performance indicators (KPIs) and critical metrics live, enabling prompt responses to emerging trends or issues. For example, real-time dashboards provide a significant competitive advantage in retail, logistics, and financial services, where market conditions change in seconds.
What Difference Real-Time Dashboards Make
Real-time dashboards will help you make informed decisions, strategize, and maintain a competitive edge with benefits like:
- Fetching data from multiple sources at a time.
- Collate data to provide a comprehensive and unified view of business operations.
- Provide businesses with information ranging from high-level executive overviews to detailed operational data for frontline managers.
- Real-time data analysis allows immediate decision-making.
- Deep data analysis with these dashboards assists in forecasting future trends and supports long-term strategic planning.
Real-Time Dashboard Templates
Dashboards must have an easy-to-navigate, intuitive interface so that users of varying expertise levels can operate it. Complex or cluttered designs can lead to misinterpretation of data or discourage user engagement.
Designing real-time dashboards is a daunting task. Let alone technical problems like synchronization and setup, the challenges of selecting a user-friendly design, and the correct matrices or KPIs are exhausting for an operation manager. That's where our real-time dashboard templates come to the rescue.
Our Real-time dashboard presentation templates offer pre-designed, user-friendly layouts that simplify the process and save time and effort in dashboard creation. The 100% customizable nature of these presentation layouts provides the desired flexibility to create fresh design options by changing fundamental elements like color, icons, fonts, etc. These content-ready PPT Slides offer structural frameworks to help you create dashboards to showcase various data types per business needs.
Let’s explore these real-time dashboard templates and Streamline the creation process for your next business dashboards!
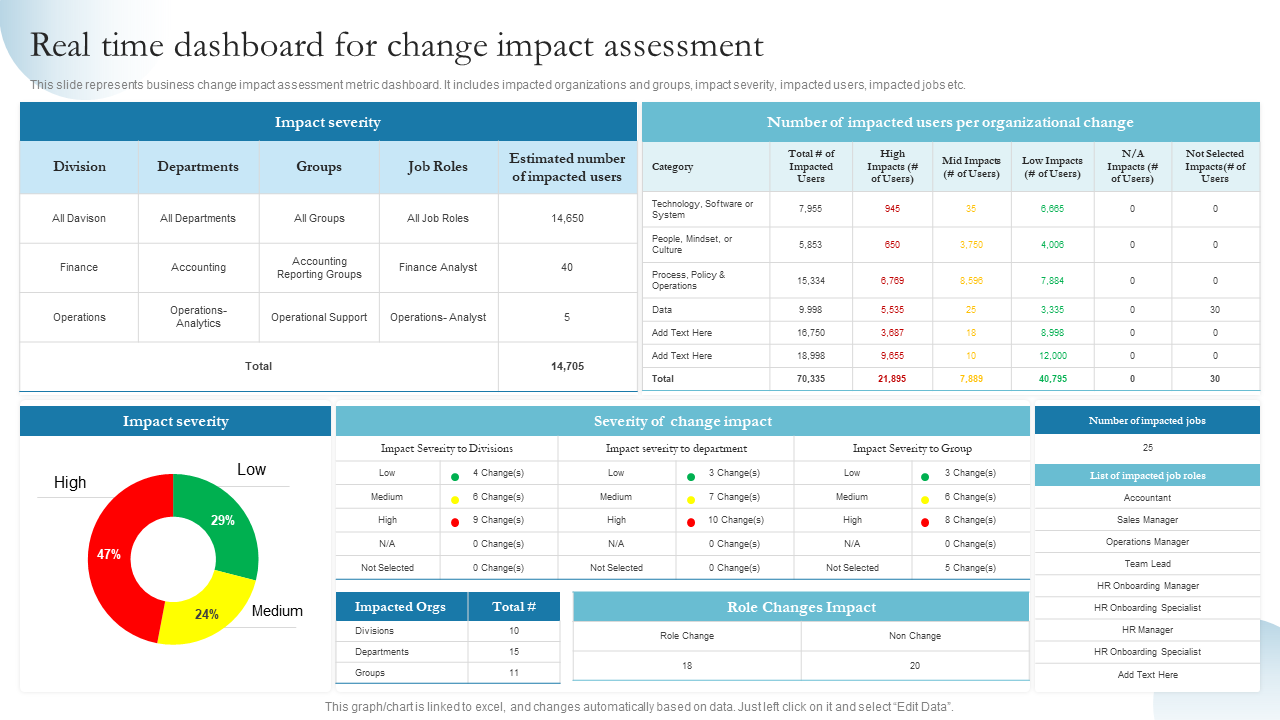
Template 1: Real-Time Dashboard Template for Change Impact Assessment
The comprehensive presentation design will help organizations evaluate the effects of change across departments and roles. This expert-designed dashboard layout displays data of impacted divisions, departments, groups, and job roles in a succinct manner. It visualizes the estimated number of users affected by organizational changes, categorizing the impact severity into high, medium, and low. The PowerPoint Slide includes a pie chart to provide a quick visual reference to the distribution of impact severity. Detailed matrices of this dashboard design offer deeper insights into specific changes, including the total number of impacted users and jobs. This PPT Template is ideal for managing transitions within technology, culture, or operational processes, allowing for real-time monitoring and strategic planning to address and mitigate the impact of change.
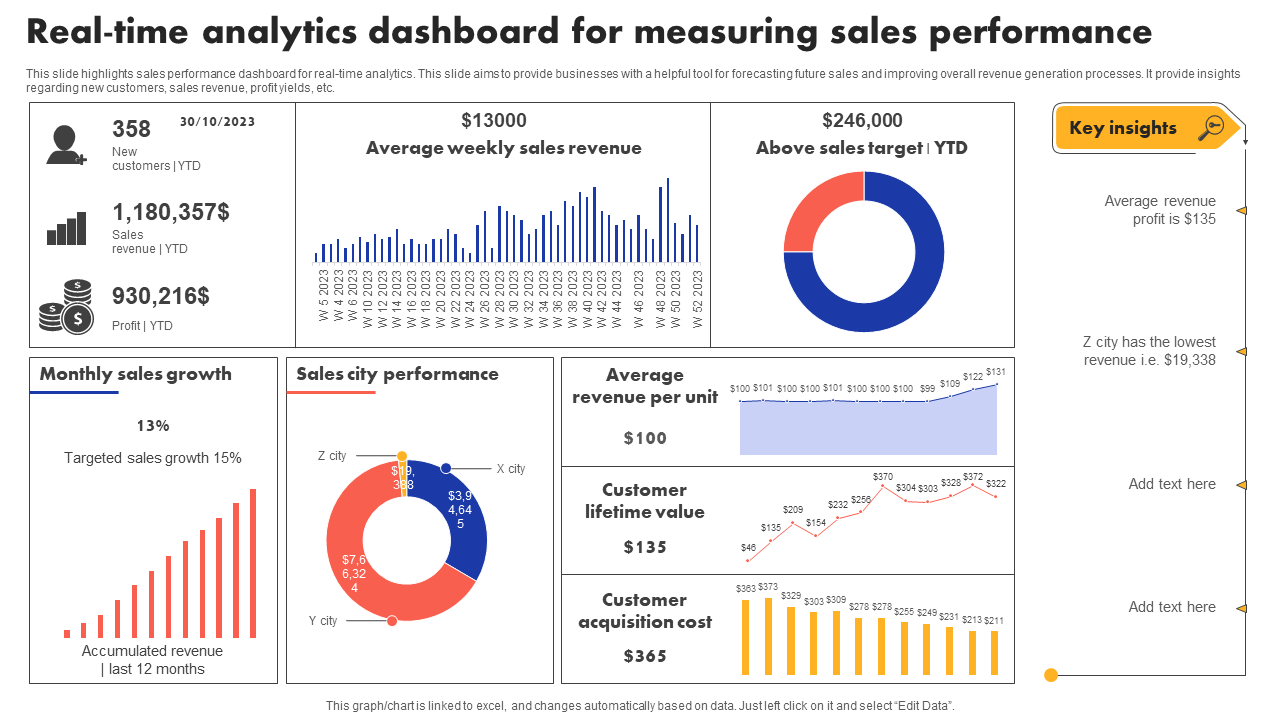
Template 2: Real-Time Analytics Dashboard Template for Measuring Sales Performance
This presentation slide is a strategic BI tool for businesses to optimize their sales performance through real-time analytics. It summarizes critical sales metrics, including new customer acquisition, year-to-date revenue, and profits, offering an instant snapshot of financial health. The dashboard has an easy-to-read bar graph to showcase average weekly sales revenue and a donut chart to break down sales by city, providing regional performance insights at a glance. It features graphs for monthly sales growth against targets, customer lifetime value, and acquisition costs for effective forecasting and strategy adjustment. The PowerPoint Design has a dedicated section to mention Key insights like average revenue, areas needing attention, etc. This dashboard will help sales managers and team leaders to track sales trends in real-time, gauge the impact of sales strategies, and drive revenue growth.
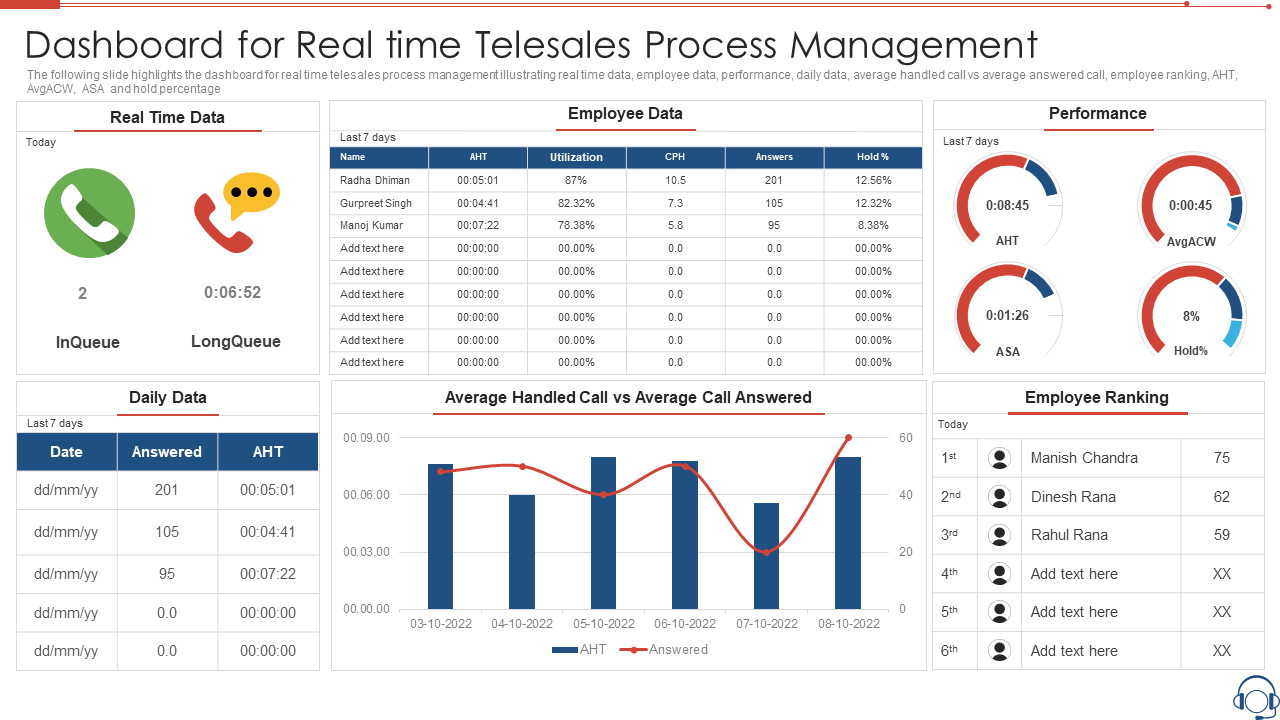
Template 3: Real-Time Telesales Process Management Dashboard Template
This dashboard layout provides a robust solution for managing and monitoring telesales operations. It showcases KPIs such as in-queue and long-queue call times to help managers manage and adapt quickly to changing call volumes. Daily data on calls answered and average handling time (AHT) are presented in an easy-to-read format to support day-to-day performance tracking. The PowerPoint Template includes an employee data section with individual performance metrics such as utilization rates, cost per hour (CPH), and hold percentages. It will help team leaders manage staffing and efficiency. The performance section has gauges that provide a quick snapshot of current service metrics like AHT, average after-call work (ACW), service level (ASA) and hold percentages. An employee ranking chart in this PPT Slide fosters a competitive environment by displaying daily rankings and motivating team members to excel. This dashboard will help tele-sales teams optimize call management, improve employee performance, and enhance operational efficiency in a fast-paced sales environment. Grab it today!
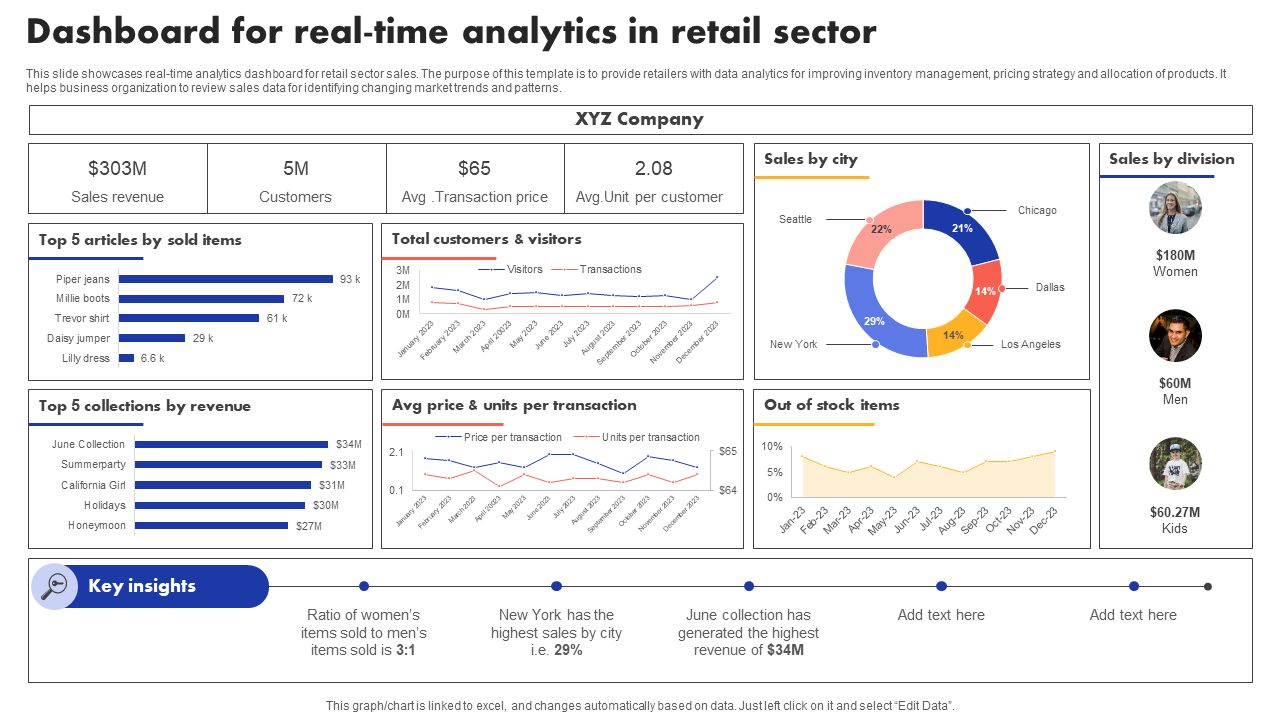
Template 4: Real-Time Analytics Dashboard Template for Retail Sector
This presentation dashboard is designed for the retail industry, providing instant insights into sales performance, customer engagement, and inventory management. It shares a birds-eye view of data points, such as sales revenue, customer counts, average transaction price, and units per customer, to deliver a real-time snapshot of market trends and business health. Retailers can use this PowerPoint Slide to track and monitor top-selling items, collections by revenue, cities' sales distribution, and sales performance by division to refine inventory allocation and pricing strategies. The dashboard template has sections for customer flow, transaction volumes over time, stock or inventory levels, and key insights. This PPT Design will aid retail and store managers in understanding product performance ratios and highlighting regional sales to help retail decision-makers optimize operations and enhance profitability.
Template 5: Real-Time Website Traffic Data Dashboard Analysis Template
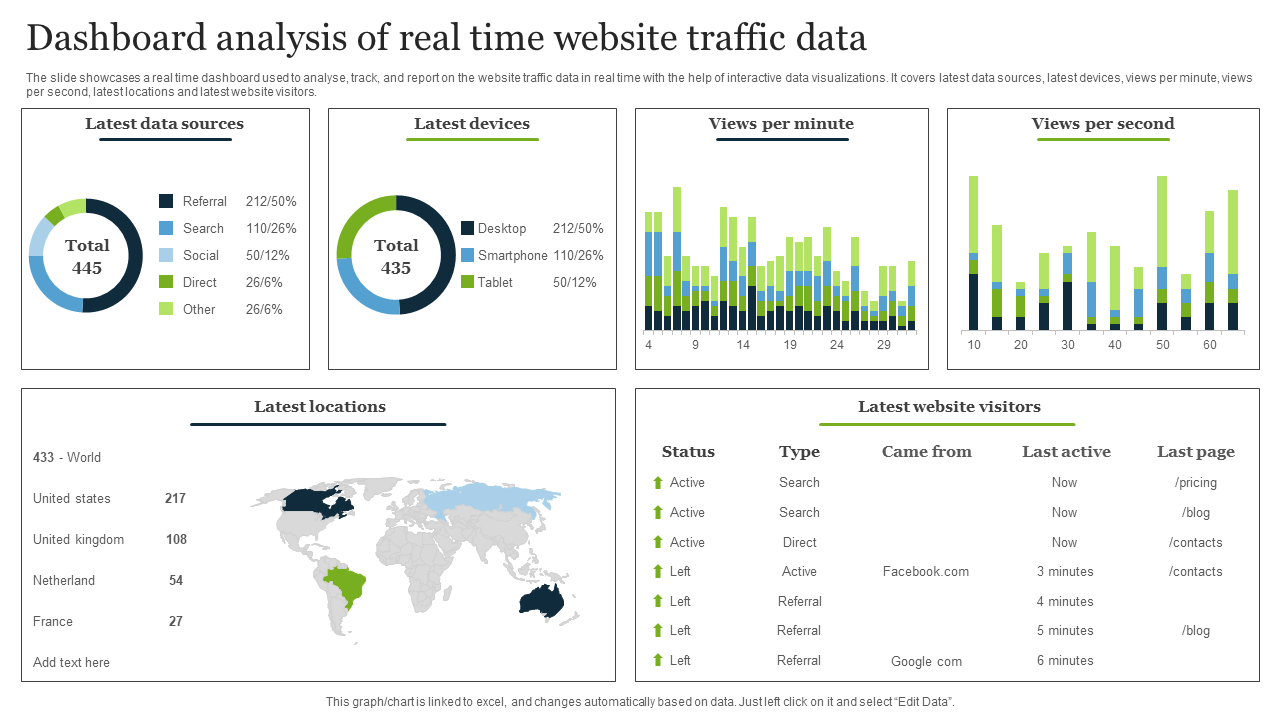
This PPT Layout will support digital marketers and website managers analyze and responding to their website's traffic in real-time. It presents a glanced view of visitor interaction data, including total visit count segmented by referral sources and visits by device type, enabling an understanding of user engagement across platforms. The visualization of views per minute and per second provides feedback on the impact of content updates or marketing campaigns. Visitor locations are pinned on a geographic map, offering insights into the global reach of the platform. It summarizes user status, visit type, last page, and last active to offer clues on user behavior and the efficiency of the website's user journey. This presentation dashboard will help optimize website performance, improve user experience, and enhance overall strategy based on current visitor data. Get it now!
Template 6: Real-Time Customer Data Software Dashboard Template
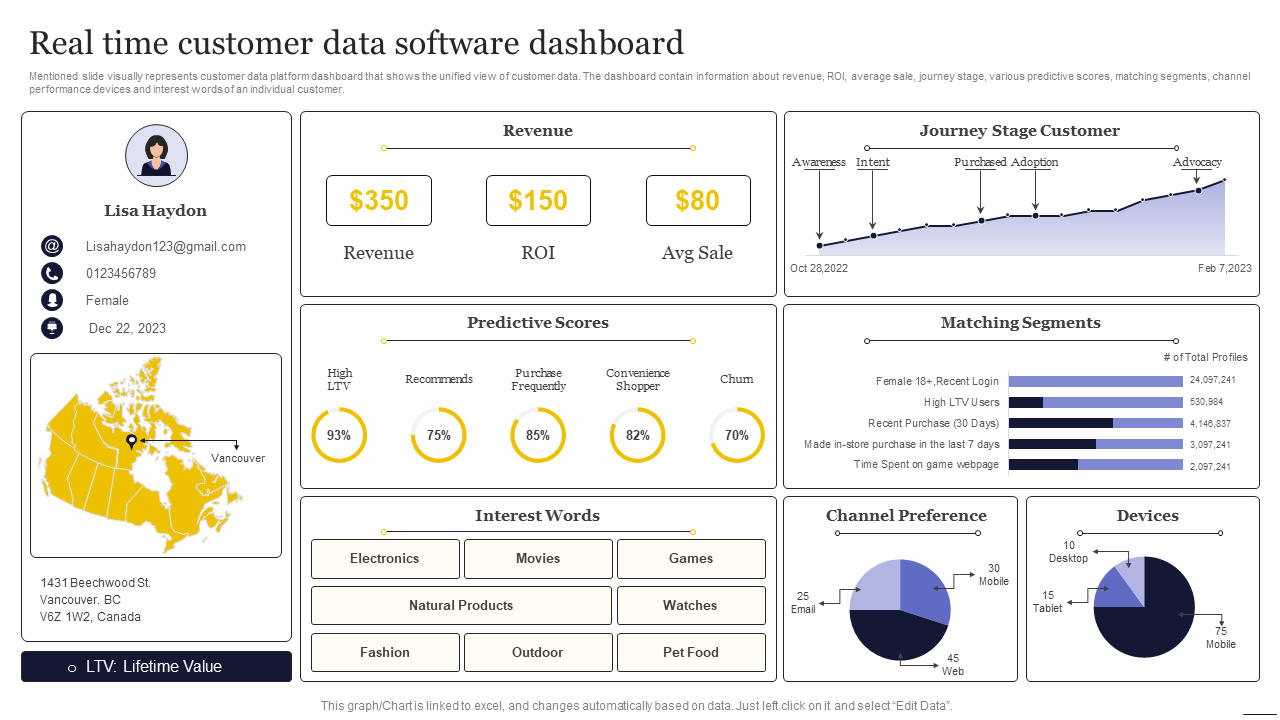
This PowerPoint Design will aid businesses in monitoring and understanding their customer's behavior and value in real-time. It integrates metrics like revenue, return on investment (ROI), average sale, and customer journey stages into a single view, sharing actionable insights into customer engagement and purchasing patterns. The PPT Design features predictive scores on customer behavior, such as purchase frequency and propensity to churn for targeted marketing strategies and customer retention efforts. It also provides segmentation data on customer demographics and their interactions with the business. The dashboard layout highlights customer preferences in communication channels and devices. It will aid marketers in optimizing multi-channel marketing campaigns, enhancing customer relationship management, personalizing customer experiences, and driving sales growth through data-driven decision-making. Grab it today!
Template 7: Real-Time Website Usage Analytics Dashboard Template
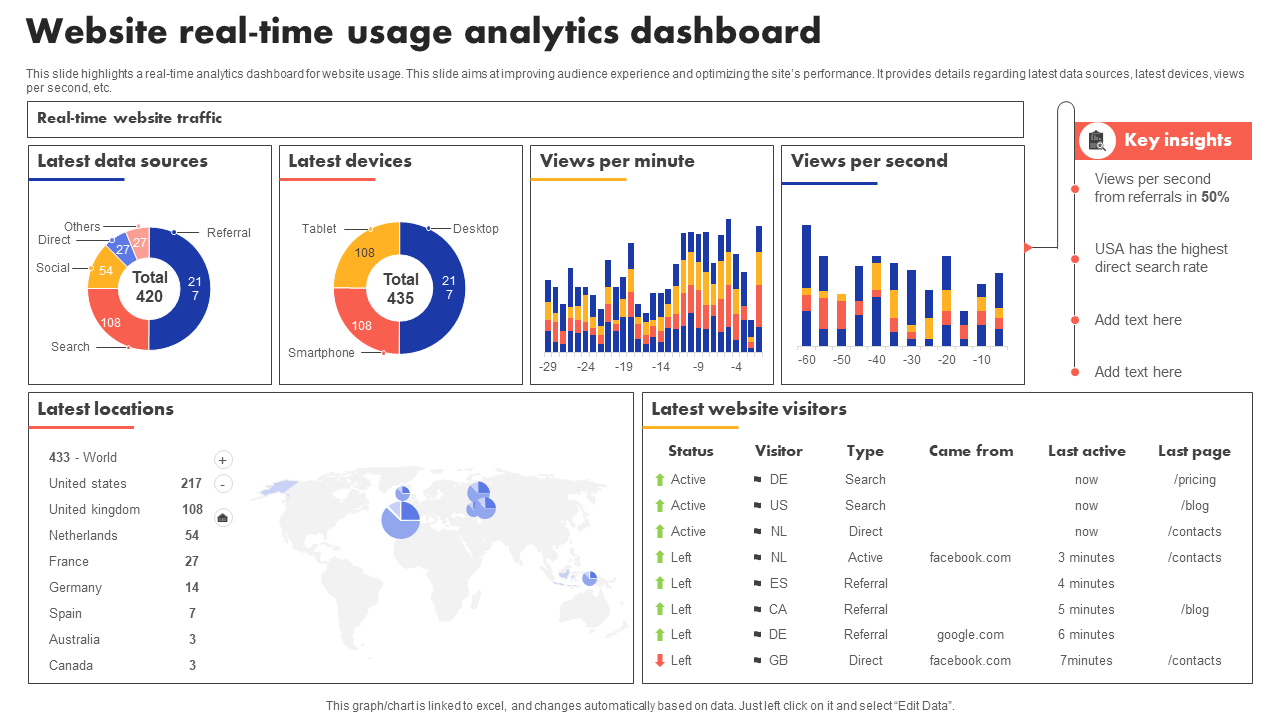
This dashboard layout collates and displays real-time traffic data, showing the number of active users by source, their devices, and their geographic locations. The PPT Slide allows you to observe the flow of visitors with metrics such as views per minute and per second, helping you determine peak traffic times and patterns. With the visitor log, you can track the activity status, origin, and engagement down to the last page visited and assess user behavior. This PPT Template is perfect for digital analysts and website managers seeking to enhance audience experience and site performance. It also has a key insight section where you can share your findings and insights from this dashboard. Get it now!
Template 8: Real-Time Analytics Dashboard Template for HR Department
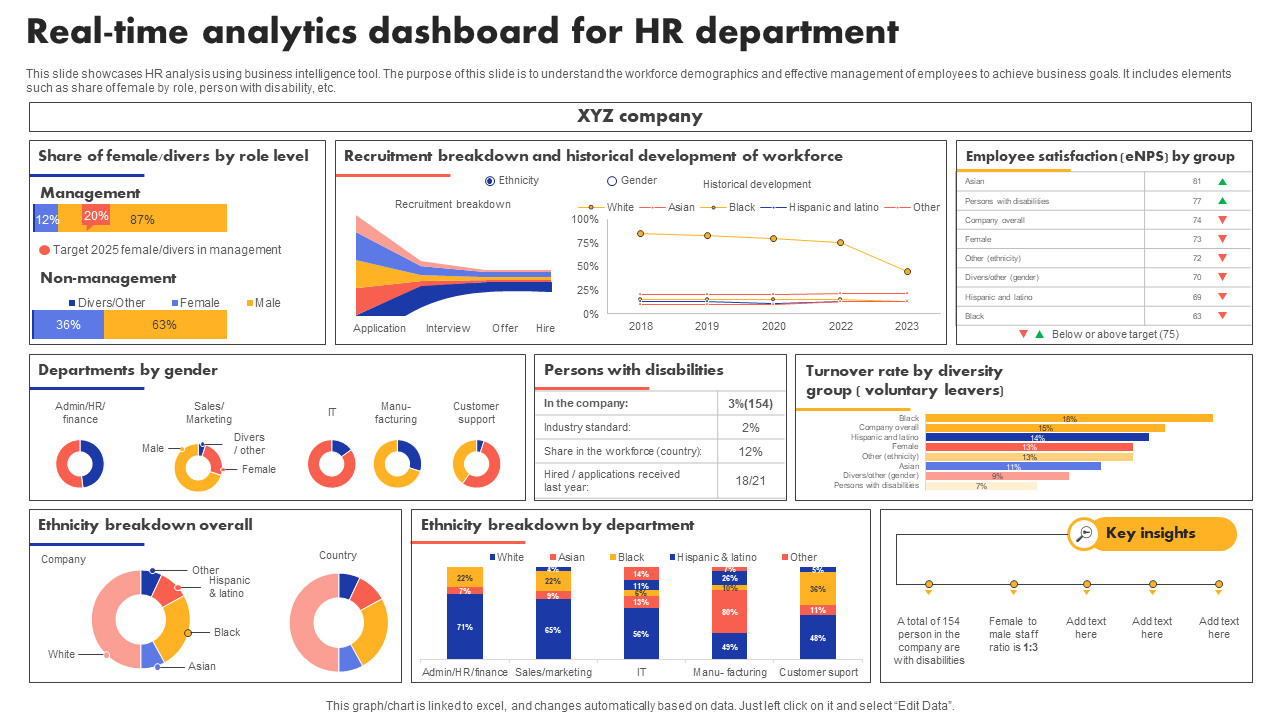
This PPT Layout is designed for Human Resources departments to help gain real-time insights into workforce demographics and dynamics. It offers a detailed overview of gender and ethnicity distribution across different roles and departments and enables HR professionals to manage and track diversity and inclusion efforts. The PowerPoint Slide also showcases data on recruitment processes, historical workforce development, employee satisfaction segmented by demographic groups, and turnover rates. It will help HRs make informed decisions regarding talent acquisition, management, and retention strategies. This dashboard design also includes sections on predictive analytics and key insights that aid in setting future targets for diversity and assessing the overall health of the organizational culture. Get it now!
Template 9: Real-Time Incident Management Dashboard PPT Template
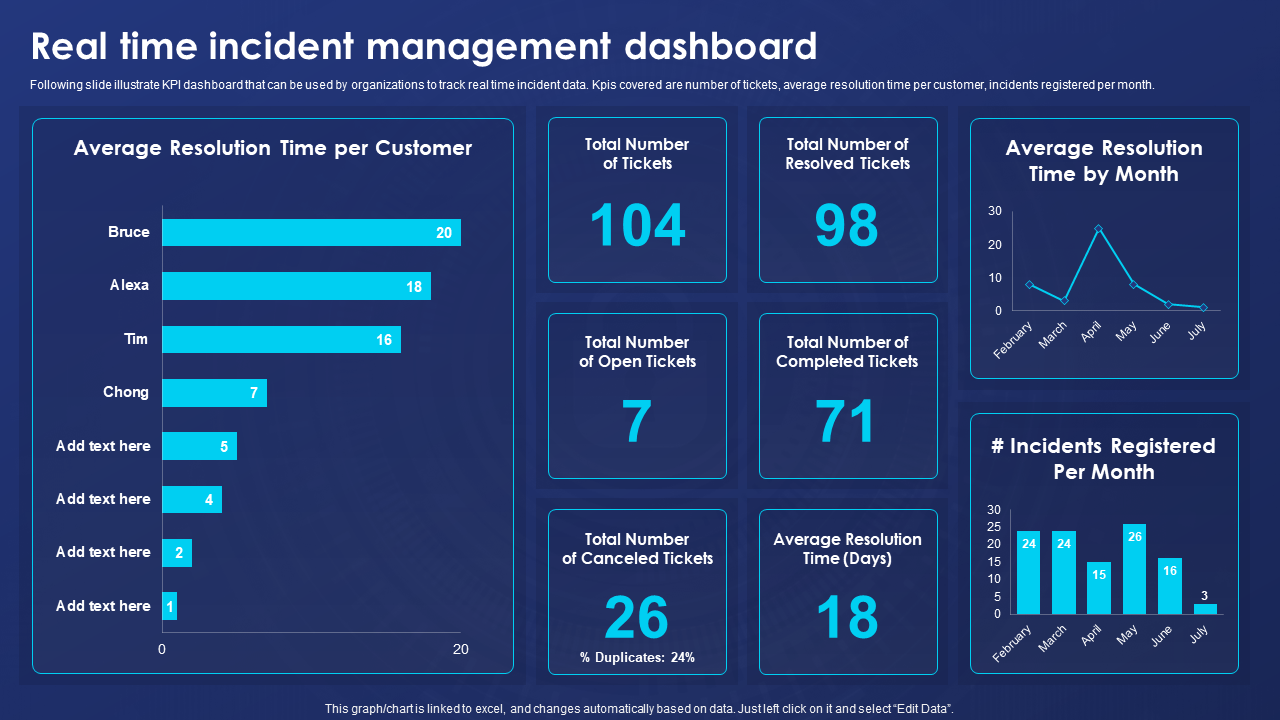
This presentation slide provides operational support teams with real-time insights into incident management. It allows for efficient KPI tracking, including the total number of tickets, average resolution time per customer, and monthly incident registration. Users can monitor the status of open, resolved, and canceled tickets, including a percentage breakdown of duplicate issues to optimize response strategies and resource allocation. Presenting average resolution time by month and individual customer metrics provides a clear view of service efficiency and team performance. This PowerPoint Design will help customer service and support teams improve incident resolution processes and maintain customer satisfaction through data-driven decision-making. Grab it today!
Template 10: Real-time Quality Dashboard Presentation Template
This PowerPoint Slide is tailored for leaders and managers to monitor and improve quality metrics in real-time. It provides a segmented view of quality KPIs, such as application performance, release readiness, and customer experience. The PPT Layout features gauge charts that display key data points, including release compliance, process adherence, test execution, and default rates, presenting current standings against set targets. This quality dashboard design is perfect for technology and product teams aiming to track progress, identify improvement areas, and ensure the highest quality standards. It will help Chief Information Officer (CIO) or Quality Assurance (QA) Managers make informed decisions and drive continuous quality enhancement. Download it now!
Finding the Right Matrices!
Real-time dashboard implementation is a strategic move for businesses to create agile, informed, and efficient business operations. It helps businesses understand data better and thrive in the data-driven world.
Our real-time dashboard templates streamline the dashboard creation process and provide user-friendly designs that align with data presentation and business needs. With these PPT Slides, you can create the ideal BI tools that share understandable real-time insights and ease informed decision-making. Use real-time dashboard templates to set a data-driven business model that enhances operational efficiency, improves strategic planning, and makes the data more accessible.
Download these real-time dashboard templates to make the dashboard creation and data analysis cakewalk!




 Customer Reviews

