


Dashboard Snapshot For Real Time Telesales Process Management




Try Before you Buy Download Free Sample Product
 Impress Your
 Audience
 100%
100% Editable
 Save Hours
 of Time


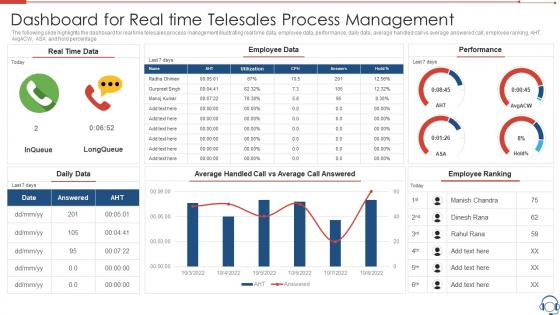
The following slide highlights the dashboard snapshot for real time telesales process management illustrating real time data, employee data, performance, daily data, average handled call vs average answered call, employee ranking, AHT, AvgACW, ASA and hold percentage
People who downloaded this PowerPoint presentation also viewed the following :
Dashboard Snapshot For Real Time Telesales Process Management with all 7 slides:
Use our Dashboard Snapshot For Real Time Telesales Process Management to effectively help you save your valuable time. They are readymade to fit into any presentation structure.






FAQs for Dashboard Snapshot For Real Time
Call volume, conversion rates, and average deal size are your must-haves - those numbers literally pay the bills. Talk time and lead response time matter too because honestly, speed kills in this business. I'd also throw in pipeline velocity since nobody wants deals sitting around forever. Track your reps individually vs team averages so you know who needs help. Oh, and keep the dashboard simple enough that you can check it quickly and know if you're hitting your monthly goals or not.
Check your conversion rates and revenue per agent first - that's where the money talks. The dashboard rankings make it super obvious who's crushing it week after week. I always look at calling patterns too, like when they're dialing and how often they follow up. Some agents just have a knack for certain products, which is weird but totally a thing. What's cool is you can see exactly what your top 3 are doing different from everyone else. Then you can actually coach people instead of just hoping they figure it out. Start with the weekly rankings and drill down from there.
Dude, real-time data is a game changer. You'll catch problems right when they happen instead of finding out tomorrow that your conversion rates tanked. Like when call volumes suddenly spike or one of your reps is having a rough day - you can actually do something about it. Jump in with some quick coaching, move leads around, whatever. Your team loves it too because they're watching their numbers climb live (honestly gets pretty competitive). Oh, and definitely set up alerts for the big stuff so you're not staring at dashboards all day like some kind of data zombie. Trust me on this one.
Dude, visualization tools are a game changer for telesales data. Charts and heat maps beat the hell out of staring at endless spreadsheets. You'll instantly see which reps are killing it, peak conversion times, where prospects drop off - all that good stuff. I actually look forward to checking our dashboard now instead of dreading it lol. The trick is picking the right chart type for what you're measuring. Oh and map out your key questions first, then build around those. Trust me, once you get hooked on visual data it's hard to go back to boring number rows.
Honestly, customer feedback is like the missing puzzle piece for your telesales data. Sure, you can stare at conversion rates all day, but that won't tell you *why* they suck. Feedback shows what's really going down during calls - maybe your team's being too aggressive, or customers are obsessed with some random feature you didn't even think mattered. I'd throw those feedback scores right into your main dashboard so you can see how sentiment matches up with performance. That way you can actually coach people instead of just guessing what's broken.
Your dashboard's historical data is basically a cheat sheet for what actually works. Peak conversion times, top scripts, best lead sources - all that stuff shows you where to focus your energy. I totally slept on seasonal patterns until I realized how crazy different Q4 was from summer! You can catch when your team starts slipping before it becomes a real problem. Don't just celebrate individual wins though. Pull 6-12 months of data and match your successful periods to whatever tactics you were running then. That's where the real insights live.
Honestly, just show them what matters most upfront - calls made, conversion rates, pipeline numbers. I've seen way too many dashboards that look like someone threw every metric at a wall. Keep colors simple but use them to flag stuff that actually needs attention. Make sure it loads quickly because nobody's got time for that spinning wheel nonsense. Test it with your team first - they'll spot the weird navigation issues you totally missed. Oh and start basic, then build from there based on what they're actually asking for. Trust me on this one.
Honestly, just add some widgets that track conversion rates and call outcomes for each test variant. Side-by-side comparisons work great - way better than those messy spreadsheets nobody wants to dig through. Set up alerts so you know when one approach is clearly crushing it. The trick is making everything visible right in your daily workflow. Your reps can then jump on the winning script or timing once the data's solid. Oh, and make it visual if you can - charts beat numbers every time for quick decisions.
So call duration matters for sales performance - it shows you how engaged customers actually are. Longer calls usually mean deeper interest, but honestly sometimes it just means your rep talks too much lol. Track average duration with your conversion rates to see who's killing it. Short calls that convert? That's efficiency right there. Long calls that don't convert mean someone probably needs coaching on when to wrap things up. I'd use this data to help reps figure out the sweet spot for timing their conversations.
Dude, CRM integration is honestly such a game-changer for telesales. You get to see everything - past calls, what they bought, all their notes - right while you're talking to them. No more "uh, remind me what we discussed?" awkwardness lol. Your conversion rates will definitely go up since you're not going in totally blind anymore. The tricky part is getting the data to sync properly in real-time. I'd start by figuring out which CRM fields actually matter for your calls first, then work from there. Worth the hassle though.
Honestly, dashboards are a game-changer for this stuff. You get all your compliance data in one spot instead of hunting through different systems - call recording rates, script adherence, do-not-call lists, the works. Visual alerts save your butt when regulations shift (which feels like constantly these days). Set up automated flags so you'll know right away if agents go off-script or call volumes get sketchy. Best part? Audit prep becomes so much easier since you can pull reports instantly. I'd definitely do weekly dashboard reviews to catch problems early. Trust me, it beats scrambling when violations pop up.
Funnel charts are your bread and butter here - they literally show the whole sales pipeline at a glance. Waterfall charts are clutch too since they make those stage drop-offs super obvious. I love using bar charts to compare how different teams or time periods are performing. Skip pie charts though, they're honestly pretty useless when you need to track flow. Heat maps are amazing for spotting bottlenecks - like maybe your team sucks at closing deals after lunch or something. Progress bars help track individual deals moving through. Start simple with just a funnel chart, then add other stuff based on what questions keep coming up.
Honestly, telesales dashboards are pretty clutch for breaking down data silos. Everyone gets the same real-time info instead of arguing over different spreadsheets. Marketing sees your lead quality data, product teams spot customer issues, finance gets solid revenue forecasts. No more awkward "which numbers are we using again?" moments in meetings - been there way too many times. When sales, marketing, and support all look at identical metrics, decisions happen faster. Just figure out what data each team actually needs first. Then set up those automated reports so you're not constantly playing phone tag about updates.
Oh man, the classic mistake is stuffing every possible metric onto one screen. Your sales team will just get overwhelmed and tune out completely. Skip the vanity metrics too - stuff that looks cool but doesn't actually help anyone make better decisions. I learned this the hard way at my last job lol. Test it with real users first because they'll catch usability problems you totally missed. Make sure your data updates often enough to matter. Honestly, stick to maybe 5-7 metrics max that actually move the needle. Less is definitely more here.
So predictive analytics basically turns your sales dashboard into a fortune teller instead of just showing old data. You'll see which leads are gonna convert, when customers might bail, what next quarter looks like – honestly it's scary accurate once you feed it enough info. Your dashboard starts auto-ranking your best prospects and suggests when to call them. It even predicts what products people want before they know it themselves (which feels weird but works). I'd pick one thing to predict first though, like conversion rates, then expand from there.
-
Design layout is very impressive.
-
Innovative and attractive designs.