

Inventory Analysis Dashboard For Planning Material Strategic Guide For Material




Try Before you Buy Download Free Sample Product
 Impress Your
 Audience
 100%
100% Editable
 Save Hours
 of Time


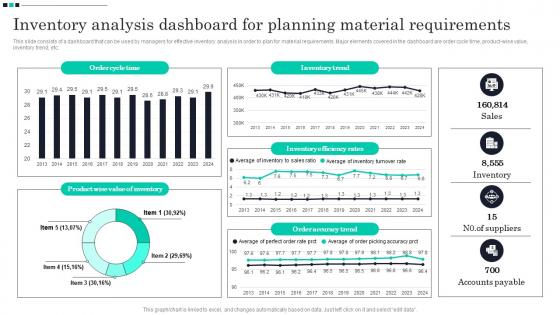
This slide consists of a dashboard that can be used by managers for effective inventory analysis in order to plan for material requirements. Major elements covered in the dashboard are order cycle time, product-wise value, inventory trend, etc.
People who downloaded this PowerPoint presentation also viewed the following :
Inventory Analysis Dashboard For Planning Material Strategic Guide For Material with all 10 slides:
Use our Inventory Analysis Dashboard For Planning Material Strategic Guide For Material to effectively help you save your valuable time. They are readymade to fit into any presentation structure.








FAQs for Inventory Analysis Dashboard For Planning Material Strategic
Start with turnover ratio, stock levels, and days sales outstanding - can't go wrong there. Stockout frequency and carrying costs matter too. Lead times are huge, especially if your suppliers are flaky. ABC analysis is solid for those exec presentations (they eat that stuff up). Demand forecasting accuracy will save you headaches down the road. Don't skip seasonal trends either. Honestly, I'd rather see a clean dashboard with these basics than some overwhelming mess with 20 different metrics. You can always add more later once you figure out what your team actually looks at regularly.
Honestly, real-time data is a total game changer. You'll catch stockouts before customers even notice, spot slow-moving stuff hogging warehouse space, and adjust reorder points based on what's actually happening. Way better than those monthly spreadsheet marathons we used to do - ugh. When demand suddenly spikes or suppliers mess up, you can react right away instead of playing catch-up later. Oh, and set up alerts for your bestsellers first since that's where you'll see the biggest impact. Trust me, once you start seeing problems the moment they pop up instead of weeks later, you won't go back.
Bar charts work best when you're comparing stock levels between different categories. Line charts are solid for tracking trends - super helpful for spotting seasonal patterns or whatever. Heat maps? Game changer for finding problem areas fast. Skip pie charts though, they're honestly trash for inventory stuff. Tables are clutch for drilling into specific SKU details, while gauges and KPI cards nail the big picture metrics like turnover rates. Just match whatever chart makes sense for the decision you need to make. Most dashboards work better with multiple viz types so people can start broad then zoom into specifics.
Yeah, seasonality screws with inventory big time. Demand shoots up during busy seasons then crashes, leaving you with either way too much stuff sitting around or angry customers who can't buy anything. Check the year-over-year charts in your dashboard first - honestly, the rolling 12-month view is where I always start since it shows the clearest patterns. The seasonal trend widgets are pretty helpful too. Your system should flag when current stock levels are way off from what's normal for this time of year. Pro tip: set up those automated alerts for seasonal thresholds now. Trust me, you don't want to be scrambling later.
So basically predictive analysis lets you get ahead of demand instead of scrambling to catch up. It takes your old sales data, seasonal stuff, market trends - all that - and figures out what you'll need in like 30-90 days. Pretty cool how it works, honestly. You can catch stockouts before they bite you and avoid getting stuck with inventory that just sits there (learned that one the hard way). The dashboard actually pings you when it's time to reorder, so customers stay happy and you're not bleeding cash on stuff that won't move.
So basically, you want a dashboard that tracks how fast stuff moves. Look for aging reports - they'll show you what's been sitting there for 60, 90, or 180+ days without selling. The heat maps are actually pretty neat, they color everything so you can instantly see what's dead (red) versus what's selling like crazy (green). Track your velocity trends too because sometimes products that used to be hot sellers just... stop moving. Oh, and set alerts for anything that sits too long - way easier than manually checking everything. You don't want to be stuck with a warehouse full of junk nobody wants.
Start with your ERP system - that's where all your main inventory stuff lives. Your warehouse management system should be next for real-time stock numbers, then POS for tracking what's actually selling. Oh, and if you've got supplier APIs or a purchasing platform, definitely connect those too since they make forecasting way less of a guesswork thing. The whole integration thing can spiral pretty fast though, so honestly just focus on those main ones first. Map out how your data flows between everything before you dive in - trust me, it'll save you from wanting to throw your laptop when stuff doesn't sync right.
Think of user roles like bouncers at a club - they decide who gets in where. Set up different permission levels so your warehouse team only sees inventory stuff, but managers get access to all the financial data. Trust me, you'll thank yourself later when you have tons of people in the system. Don't let everyone edit everything either. Only give editing rights to people who actually need them for things like pricing updates. Seriously though, do this setup right away or you'll end up with someone accidentally nuking important data.
Honestly, mobile compatibility is a game-changer. You can check stock levels from literally anywhere - warehouse floor, vendor meetings, even when you're stuck in traffic wondering about that urgent reorder. Real-time updates mean you're not waiting until you're back at your desk to approve purchase orders or fix inventory alerts. The dashboard actually works on phones too, so no squinting at microscopic numbers. Trust me on this one - get your team set up ASAP. Being able to make inventory calls outside office hours? That's the difference between catching problems early and scrambling later.
Honestly, I'd focus on three main things. First, check industry averages - most sectors see 4-6 turns annually. Then look at your own past performance to spot any weird trends. Seasonal stuff matters too, especially if you're dealing with retail or manufacturing. Oh, and definitely break it down by product category since some things just move way faster than others. I'd probably pull the last 12 months of data first and segment by product line. That should give you a pretty solid picture of what's actually happening versus what you think is happening.
So basically, your inventory dashboard shows you which suppliers are actually reliable and which ones suck. Track stuff like delivery times and how often they mess up orders - you'll be shocked at the differences between suppliers. Quality issues pop up through return rates too. I'd set up alerts for when suppliers drop below your standards, that way you're not frantically calling around when you run out of stuff. The patterns in lead times really aren't obvious until you see them all laid out like this. Way better than just looking at individual orders.
Look, FIFO basically means you sell your oldest stuff first - otherwise you're gonna end up with expired products just sitting there. Obviously super critical for food, but even random non-perishables get outdated eventually. Your inventory system should show you how old each batch is so you know what needs to go first. I'd set up some kind of alert for anything that's been hanging around too long. Gets your cash flowing better and customers aren't getting stale products. Plus way less waste, which honestly saves you money in the long run.
Yeah, so basically you set up different views for different people. Warehouse folks need the real-time inventory stuff and those reorder alerts. Executives want the big picture trends and cost breakdowns - you know how they are. Finance will literally live in those margin reports, I swear. Just give people role-based access so they're not drowning in irrelevant data. Customize the layout for each group, maybe throw in some automated reports. Honestly, the best approach is just asking each team what decisions they're actually trying to make. Then build something that helps them decide faster instead of just looking pretty.
Automate your data feeds if you can - that's where most screw-ups happen with manual entry. Weekly reconciliation against your warehouse systems is non-negotiable. Oh, and set up validation checks for crazy stuff like negative inventory counts. Your team needs to know exactly when data refreshes, otherwise people make decisions off stale numbers (been there). Build alerts for when things don't match up between systems. Trust me, catching discrepancies early saves you from way bigger headaches later. Those little inconsistencies have a habit of turning into disasters if you ignore them.
Here's what I'd do - pull 12-18 months of your inventory data first. Look for seasonal patterns and how fast stuff moves during different periods. The dashboard should show you when stockouts happen most and how long your lead times actually are. Year-over-year comparisons are honestly where the magic happens - you'll catch patterns that aren't obvious otherwise. Also check which products always seem to surprise you (good or bad). Once you spot these trends, set up some automated alerts so you're not constantly checking manually. Makes forecasting way less of a guessing game.
-
Wow, never been this impressed with any online service provider. Really appreciate the customer support all along from the navigation to purchasing the right products.
-
Wonderful templates design to use in business meetings.