

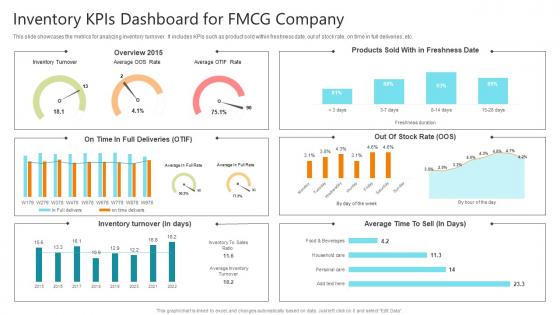
Inventory Kpis Dashboard For FMCG Company




Try Before you Buy Download Free Sample Product
 Impress Your
 Audience
 100%
100% Editable
 Save Hours
 of Time


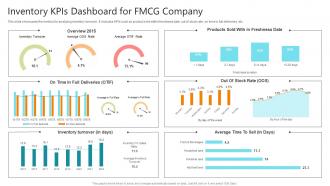
This slide showcases the metrics for analyzing inventory turnover. It includes KPIs such as product sold within freshness date, out of stock rate, on time in full deliveries, etc.
People who downloaded this PowerPoint presentation also viewed the following :
Inventory Kpis Dashboard For FMCG Company with all 7 slides:
Use our Inventory Kpis Dashboard For FMCG Company to effectively help you save your valuable time. They are readymade to fit into any presentation structure.





FAQs for Inventory Kpis Dashboard
Track inventory turnover first - that's the big one since it affects everything else. Also watch your stockout rate (running out of stuff people want) and GMROI. Days sales outstanding shows how long inventory just sits there, which kills cash flow. Carrying costs and shrinkage are sneaky profit killers too. I'd honestly obsess over turnover if I could only pick one metric. Oh, and don't forget to benchmark against industry averages first - otherwise you're just guessing what "good" looks like. Set realistic targets from there.
Look at your inventory turnover ratio monthly - it'll show you exactly which stuff is just sitting there draining money. I've watched companies slash their holding costs by 20-30% once they get serious about moving slow stock. Honestly, most businesses are way too conservative with markdowns. Calculate turnover for your biggest categories first, then get aggressive with bundling or discounting anything that's been sitting around too long. Better demand forecasting helps too, but that takes time to dial in. You don't want empty shelves obviously, but you also can't afford to warehouse products forever.
When customers can't find what they want, they bail - and honestly, who can blame them? Your stockout rate basically tracks how often you're disappointing people. High rates usually mean you're ordering too little or your suppliers suck. The smart move is breaking it down by product type and season to catch patterns. Once you see what's always running out, bump up those reorder points. It's way better than having awkward "we're out of stock" conversations all the time. Plus you'll spot which products need better demand planning.
So DIO basically shows you where your supply chain is getting clogged up - like when inventory just sits there collecting dust instead of moving. When those numbers start creeping up, you're probably ordering too much or your demand forecasting is pretty off (happens to the best of us). Compare your DIO to industry benchmarks and track it monthly to spot the trends. Short bursts work better than long sentences sometimes. From there, you can tweak your ordering schedule or push suppliers for better terms. I'd set different target ranges for each product category since they all behave differently.
So basically carrying costs are just bleeding money from your profits. You're paying for storage, insurance, all that stuff while your inventory just sits there doing nothing. Super frustrating honestly. Those dollars could be working way harder somewhere else in your business instead of collecting dust. Track how fast you're turning inventory - even small improvements there can free up serious cash. I'd start with whatever's moving slowest. Discount that stuff or just stop ordering more until you clear it out. Makes a huge difference on your margins.
Rolling forecasts are your friend here - track how accurate they are and tweak reorder points when you spot patterns. Seasonal stuff especially. ABC analysis is clutch since your top sellers need different treatment than slow movers. Most companies honestly just panic-buy inventory because stockouts freak them out, but that kills your cash flow. I'd set up alerts when stock hits certain levels and check dead inventory monthly (ugh, such a pain but necessary). Calculate your turnover ratio first though - if it's lower than industry standards, you're definitely overstocked.
You want **Inventory Record Accuracy** for this one. Just take however many items actually match between your system and physical counts, divide by total items counted, times 100. Pretty straightforward. Most places shoot for 95%+ - honestly anything under 90% means you're gonna have some real headaches on your hands. Don't wait around for those annual inventory marathons either. Regular cycle counts are way better for catching problems early. I'd track it monthly if I were you. You'll start noticing patterns and problem spots pretty quick once you get into the rhythm of it.
Longer lead times are killer - you'll need way more safety stock sitting around, which tanks your turnover rates. Honestly, the best move is spreading orders across multiple suppliers instead of relying on just one. Work on your demand forecasting too, since better predictions help a ton. I'd also push back on whatever lead times they quote you - negotiate actual commitments in contracts rather than just taking their word. Building solid relationships with suppliers makes a huge difference. Oh, and definitely map out your current lead times first to see where you're getting hit the hardest.
So here's the thing - calculate GMROI by category and individual SKUs, not just your whole inventory. Monthly tracking is key. Your high GMROI items? Those are your money makers, invest more there. The low performers are just burning cash honestly. Set minimum thresholds and flag anything that falls short for repricing or maybe just cut it entirely. I mean, it really cuts through the BS and shows what's actually making money per dollar you put in. Start with benchmarking where you're at now, then let those numbers guide your buying decisions.
Perfect order metric tracks when everything goes right in one shipment - correct items, quantities, on-time delivery, good condition, proper paperwork. Super useful because you'll quickly see where things break down most. Could be inventory issues or your warehouse damaging stuff (seriously happens all the time). Fix those specific problems and you cut costs from returns and rush orders. Your inventory planning gets better too since you're not always putting out fires. I'd track it monthly and tackle whatever's failing most first - that's gonna give you the biggest bang for your buck.
ABC analysis is your best friend here - focus on counting high-value stuff more often. RFID tags are honestly a total game-changer, way faster than manual counts and fewer mistakes. Mobile apps with barcode scanning will give you real-time data instead of waiting around. Oh, and track your accuracy by location and who's doing the counting - you'll spot who needs more training pretty quick. Perpetual inventory beats calendar-based counting since it's triggered by actual transaction volume. Test one small area first though, prove it works before you go crazy rolling it out everywhere.
So first, figure out which metrics actually matter for your business - inventory turnover, carrying costs, stockout rates, that kind of stuff. Trade associations have good industry data, or you can dig through public companies' annual reports (kind of a pain but worth it). Some newer ERP systems come with benchmarking built right in, which saves time. Just make sure you're comparing against similar companies - same size, seasonality patterns, supply chain setup. Otherwise the data's pretty useless. I'd start tracking maybe 3-4 key metrics quarterly so you don't go crazy with spreadsheets. Set targets that actually make sense, not some pie-in-the-sky numbers.
So these reports basically show you what's been collecting dust in your warehouse forever. You'll see which products aren't moving and are just draining your cash. Pretty eye-opening when you realize you've got like $50K worth of random stuff nobody wants anymore. They help you catch slow sellers before they turn into total dead weight. Plus you can spot seasonal patterns and see if you're actually buying what people want. The velocity data helps you nail down better reorder timing too. I'd use it to push for supplier discounts or plan sales before things get completely worthless.
So this is basically about finding balance - too little inventory and you're missing sales, too much and your cash is just sitting there doing nothing. I learned this the hard way honestly. You want your inventory turns to actually match what people are buying. Track your turnover ratio with days sales outstanding to get the real story. High velocity products with low stock levels? You're bleeding money from stockouts. Slow movers hogging shelf space? That's cash you could use elsewhere, plus stuff goes obsolete. Start by figuring out which products have the best velocity-to-inventory ratios and use those as benchmarks.
Dude, Excel's gonna drive you crazy for real-time tracking - trust me on this one. You need something like NetSuite, Fishbowl, or TradeGecko that actually pulls data automatically. These platforms connect your warehouse system, POS, and accounting stuff so everything talks to each other. Live dashboards are a game changer. First thing I'd do? Map out what systems you're already using. Then find something that plays nice with those integrations. Cloud-based is definitely the way to go since it updates continuously without you having to do anything.
-
“I've always gotten excellent slides from them and the customer service is up to the mark.”
-
This visual representation is stunning and easy to understand. I like how organized it is and informative it is.