


 0 Comment
 Customer Reviews

Did you know that the FMCG sector is one of the booming markets in the world, with thousands of products, brands, and customers? Well, the secret behind their success is how they keep track of sales, stock, and trends. And that is where an FMCG Dashboard comes in. It gives a clear view of how your brand, products, and stores are performing and helps you make smart decisions. It also shows your sales performance dashboard, where you can mention product demand and customer interest all in one place.
Click here to learn about trend dashboards and prepare smart reports.
If you use FMCG Analytics, you can easily check product performance metrics and find which products are selling fast and which ones need help. You can monitor supply movement through a detailed Inventory Management Dashboard and avoid overstock or stockouts.
For a better understanding of the brand, you must implement a Brand Performance Dashboard and conduct market trends/share analysis. It will definitely assist your team in making better marketing and pricing moves. Now, if you want to structure your FMCG reports, try using our clean, professional templates and improve overall team productivity. These documents are perfect for making smart reports fast and monitoring sales, product performance, market trends, and brand insights with just a few clicks.
Also, check out our Delivery Dashboard Templates with Samples and Examples
With these PowerPoint templates, you can cover all areas like inventory, retail, consumer insights, and sales forecasting in one place. You can also compare and improve marketing trends using clear visuals. And since these slides are entirely customizable and editable, you can modify the content and present your own data.
Now, let us explore our Top 10 FMCG Dashboard Templates with Examples and Samples
Template 1: FMCG Analytics PPT Demonstration
Add this simple template to your presentation bundle and discuss critical aspects of FMCG analytics. It shows industry dynamics, data sources, key metrics, consumer behavior analysis, sales data analytics, etc. It also displays supply chain optimization techniques, market basket analysis, and pricing strategies. The template illustrates customer segmentation, forecasting demands, retail analysis, store performance, etc. Download it now and present your data in clear and concise language.
[product_image id=1279596]
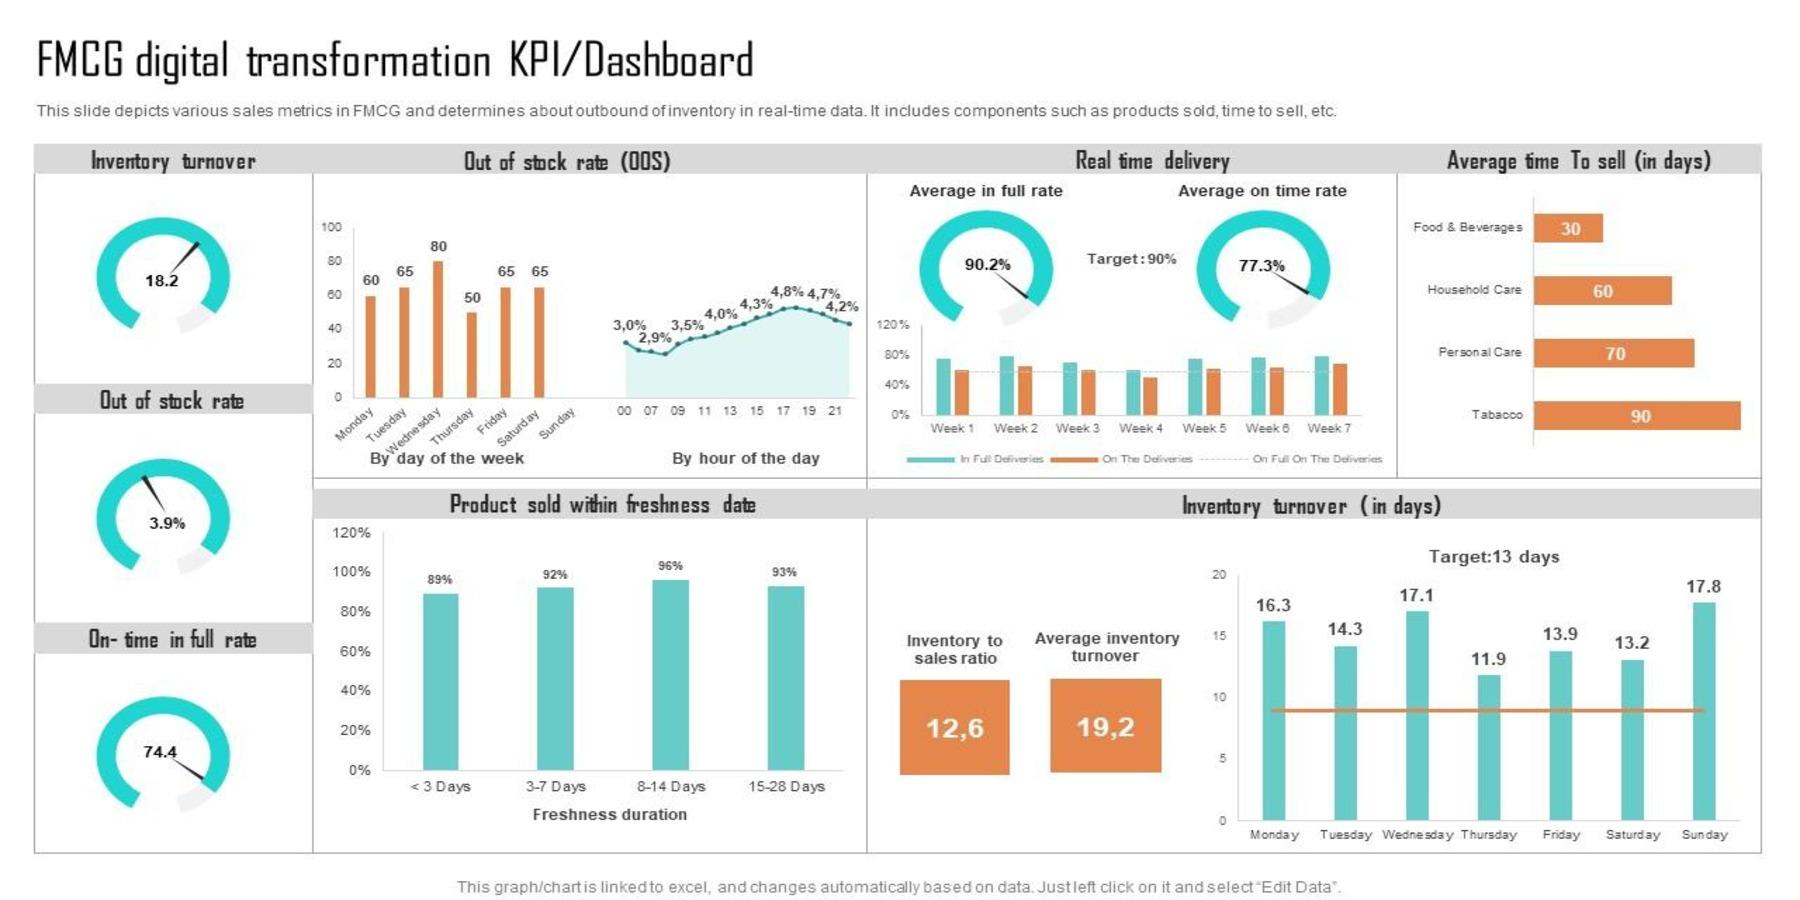
Template 2: FMCG Digital Transformation KPI Dashboard
With this visual tool, you can track how well your FMCG business is going digital. You can show progress using key numbers (KPIs) and see if their digital plans are working or not. So, use the following template to depict different sales metrics in FMCG and establish inventory status in real-time data. It includes components such as products sold, out of stock rate, average time to sell, real time delivery, inventory turnover, etc. Also, add a few extra elements to this document and compare digital results across regions, products, or teams. So, get it now and set goals for digital growth and monitor them closely.
Template 3: FMCG Industry Business Intelligence Dashboard
A Business Intelligence dashboard shows real-time business data from the FMCG sector. It can guide your team to learn current and past trends, track sales, check product performance, and understand customer behavior—all in one screen. You can include this attractive template in your list and illustrate the BI dashboard. It shows details related to the average time to sell food and beverages, household care, personal care, etc. It also displays average inventory turnover, inventory related to sales ratio, product sold, on time in full deliverables, out-of-stock rate, etc. Download it now and track and monitor major performance metrics.

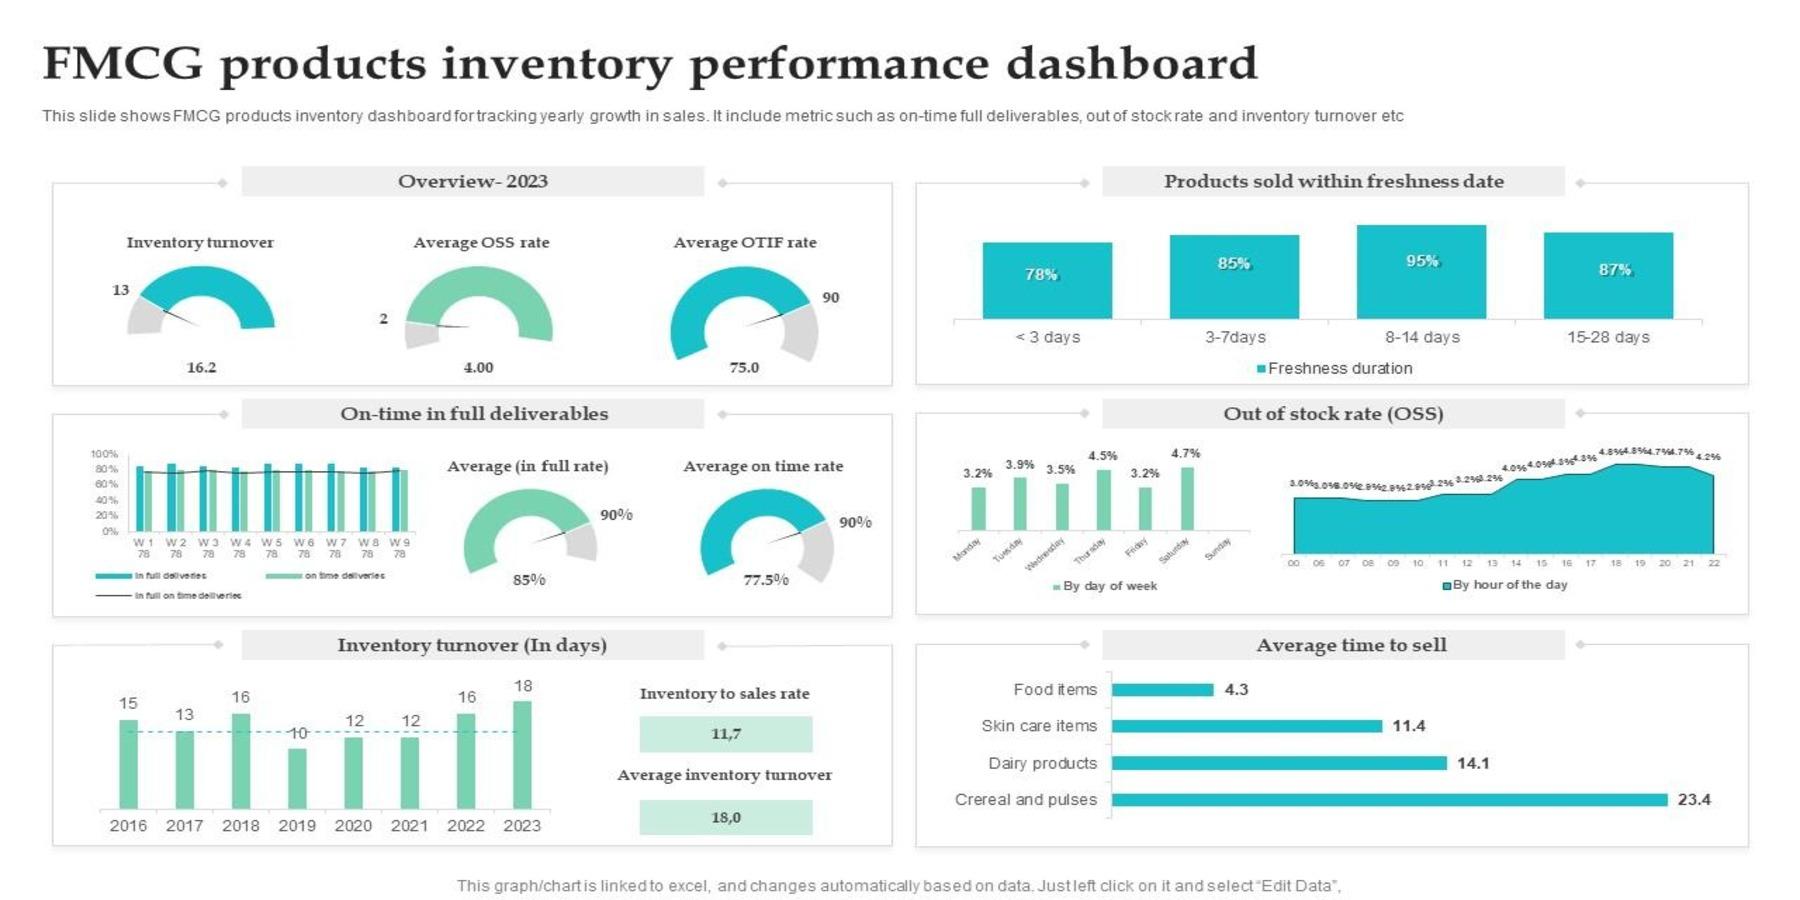
Template 4: FMCG Products Inventory Performance Dashboard
An inventory performance dashboard can help FMCG companies monitor how well their product stock is moving. It supports better planning for promotions or discounts based on stock levels. To get some idea about this tool, check out the following template. It will show how the FMCG product inventory dashboard can explain yearly growth in sales. It displays metrics such as on-time full deliverables, out-of-stock rate, products sold within freshness date, inventory turnover, etc. Now, click on the link below and get the template now! It can tell you which products are selling fast and which ones are taking long.
Template 5: Market Research Report Dashboard Snapshot of FMCG Industry
The Market Research Report explains what’s happening in the market, like what’s selling and what needs improvement. It shows key facts and insights about the fast-moving consumer goods (FMCG) market. You can use the following template and describe the market research report of FMCG in a structured way. It includes parameters such as sales by location, sales by square foot, units per transaction, and total products sold. The template also shows metrics like net profit, shrinkage rate, revenues, and customer retention rate. So, download the template now and share your research results in meetings without extra design work.

Template 6: Inventory KPIs Dashboard for FMCG Company PPT Template
An Inventory KPIs Dashboard gives a clear picture of FMCG stock, supply movement, and product availability. This structured format helps your team understand how fast items are selling, how much stock is left, and when to reorder. So, consider the following template as an option to showcase the metrics for analyzing inventory turnover. It incorporates important KPIs such as average OOS and OTIF rate, inventory turnover, product sold within freshness date, out of stock rate, on time in full deliveries, etc. Get the template from the link and learn about the stock health across stores and warehouses.

Template 7: Overview of FMCG KPI Dashboard With Inventory Turnover PPT Template
The following template illustrates the overview of the FMCG KPI Dashboard with Inventory Turnover. It describes the main performance numbers for FMCG businesses, which tells how often stock is sold and replaced. It can help businesses see how well their products are moving and how fast their supply chain works. Here, in this template, you can discuss relevant data and facts related to the Product, Stock, Average Selling Time, etc. Also, you can easily modify the content of this document and add some elements according to your project needs.

Template 8: Analysis of FMCG Financial Dashboard With Supply Chain Costs PPT Template
Analyzing an FMCG dashboard will help you spot where money is leaking in the supply chain. It supports better budgeting with clear data on costs and profits. So, add this attractive template to your list and explain finance and supply data visually. It shows key cost parameters such as supply chain cost by category, carrying cost of inventory, supply chain cost vs sales, etc. This format can easily track spending across regions, warehouses, and vendors. So, download the template and make your finance reports look professional and simple to understand.

Template 9: FMCG Products Delivery Dashboard With Inventory Turnover PPT Template
The dashboard tells you the present condition of your stock availability. It can give you a quick idea of how to plan the delivery timelines and check how often inventory gets used up and restocked. So, use this simple template to keep the supply chains smooth and avoid overstock or stockouts. Here, you can describe different inventory and sale parameters based on the requirements of your brand. Download the template now and improve coordination between sales, warehouse, and delivery teams using one shared view.

Template 10: Online and Retail Cross Selling Strategy Sales Dashboard PPT Slides
The colorful layout shows important performance metrics related to sales by customer division, city, and stock items. Here, you can include monthly sales graphs, top-selling products with their numbers, etc. Also, mention other sale parameters to create easy monthly reports. Get the template now and impress your audience!

Conclusion
With a solid FMCG Dashboard, you can monitor key sales of your organization, inventory, and customer data in one place. It will guide your team to make smart choices based on real-time facts, numbers, and trends. It also uses Retail reporting Dashboards, Sales Performance Dashboards, Market Trends Analysis tools, etc. These tools can support Inventory Management and Product Performance Metrics, which give an overview of important business insights.
Now, with readymade PPT templates, you can easily create and share these dashboards. You don't need to start from scratch; you can directly implement them in your project operations after a little modification. Here, you can also include diagrams, charts, graphs, and easy visuals to present complicated business data. This way, you can get fast updates and handle sales, supply, or inventory. So, what are you thinking? Download the templates now and reap their benefits!
PS: Also, check out our Top 10 Usage Dashboard Templates With Examples and Samples.
FMCG Dashboard Templates
What is an FMCG Dashboard, and why is it important?
An FMCG Dashboard is a visual tool with which you can illustrate live sales, product, and customer data in one view. It can show what products you are selling, what’s not, and how buyers are behaving. It tracks each and every performance metric and assists you find issues or trends. It supports better decisions using real-time facts and keeps everything on the right track.
Which key metrics should it track?
An FMCG dashboard should track sales per product, performing items, stock levels, product returns, and regional demand. Additionally, it should track brand growth, regional sales trends, market share, and customer feedback. And metrics like delivery time, forecasting sales, and supplier reliability are also there to improve your project performance. The dashboard can play a big part in reducing waste and increasing profits across all departments.
What types of data sources are typically integrated into an FMCG Dashboard?
FMCG Dashboards usually take data from POS systems, customer surveys, inventory systems, websites, social media platforms, and supply chains. They also pull live data from industries and warehouses, sales teams, and eCommerce sites. The dashboard combines online and offline sources and gives a full picture of what’s happening in sales, stores, and customer minds.