Powerpoint Templates and Google slides for Average
Save Your Time and attract your audience with our fully editable PPT Templates and Slides.
-
 Average Long Term Investment Returns powerpoint presentation and google slides ICP
This PowerPoint presentation provides an overview of average long term investment returns. It examines the various factors that influence returns, such as inflation, market volatility, and the risk return tradeoff. It also looks at the different types of investments and the potential returns they can generate. The presentation also provides an in depth look at the historical performance of the stock market and other asset classes. Finally, it offers practical advice on how to maximize returns while minimizing risk. This presentation is ideal for investors looking to understand the fundamentals of long term investing and how to maximize their returns.
-
 Average Small Business Employee Size powerpoint presentation and google slides ICP
This PowerPoint presentation provides an overview of the average small business employee size. It examines the current trends in small business employee size, the benefits of having a smaller team, and the challenges associated with having a larger team. It also provides tips on how to effectively manage a small business team and how to determine the right size for your business. The presentation is ideal for small business owners and entrepreneurs who are looking to understand the average small business employee size and how it can impact their business.
-
 Average Return On Investments powerpoint presentation and google slides ICP
This PowerPoint presentation provides an overview of Average Return on Investment ROI. It explains the concept of ROI, how it is calculated, and how it is used to measure the performance of investments. It also provides examples of how ROI can be used to compare different investments and measure the success of an investment over time. This presentation is ideal for investors, financial advisors, and anyone interested in learning more about ROI and its importance in making sound investment decisions.
-
 Average Advisory Fees Investments Powerpoint Presentation And Google Slides ICP
Unlock the potential of your presentation with our versatile Icon PowerPoint template, offering both editable PPTx and customizable PNG formats. This deck is entirely editable, enabling you to craft a message that resonates. Additionally, you maintain complete image ownership, affording you the freedom to utilize them as needed, all through the intuitive interface of PowerPoint.
-
 Average Handling Time Powerpoint Ppt Template Bundles
Deliver a credible and compelling presentation by deploying this Average Handling Time Powerpoint Ppt Template Bundles. Intensify your message with the right graphics, images, icons, etc. presented in this complete deck. This PPT template is a great starting point to convey your messages and build a good collaboration. The twelve slides added to this PowerPoint slideshow helps you present a thorough explanation of the topic. You can use it to study and present various kinds of information in the form of stats, figures, data charts, and many more. This Average Handling Time Powerpoint Ppt Template Bundles PPT slideshow is available for use in standard and widescreen aspects ratios. So, you can use it as per your convenience. Apart from this, it can be downloaded in PNG, JPG, and PDF formats, all completely editable and modifiable. The most profound feature of this PPT design is that it is fully compatible with Google Slides making it suitable for every industry and business domain.
-
 Research Market Average As A Salary Negotiation Tip Training Ppt
Presenting Research Market Average as a Salary Negotiation Tip. This slide is well crafted and designed by our PowerPoint specialists. This PPT presentation is thoroughly researched by the experts, and every slide consists of appropriate content. You can add or delete the content as per your need.
-
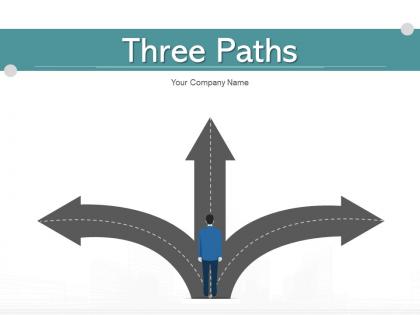 Three paths average cost process diagram professionals infographic
Deliver a lucid presentation by utilizing this Three Paths Average Cost Process Diagram Professionals Infographic. Use it to present an overview of the topic with the right visuals, themes, shapes, and graphics. This is an expertly designed complete deck that reinforces positive thoughts and actions. Use it to provide visual cues to your audience and help them make informed decisions. A wide variety of discussion topics can be covered with this creative bundle such as Average Cost, Process Diagram, Professionals Infographic. All the fourteen slides are available for immediate download and use. They can be edited and modified to add a personal touch to the presentation. This helps in creating a unique presentation every time. Not only that, with a host of editable features, this presentation can be used by any industry or business vertical depending on their needs and requirements. The compatibility with Google Slides is another feature to look out for in the PPT slideshow.
-
 Performance management kpi revenue opportunities product target average
Deliver a lucid presentation by utilizing this Performance Management KPI Revenue Opportunities Product Target Average Assets. Use it to present an overview of the topic with the right visuals, themes, shapes, and graphics. This is an expertly designed complete deck that reinforces positive thoughts and actions. Use it to provide visual cues to your audience and help them make informed decisions. A wide variety of discussion topics can be covered with this creative bundle such as Revenue Opportunities, Product Target, Average Assets. All the thirteen slides are available for immediate download and use. They can be edited and modified to add a personal touch to the presentation. This helps in creating a unique presentation every time. Not only that, with a host of editable features, this presentation can be used by any industry or business vertical depending on their needs and requirements. The compatibility with Google Slides is another feature to look out for in the PPT slideshow.
-
 Incident process average time database developer planning
If you require a professional template with great design, then this Incident Process Average Time Database Developer Planning is an ideal fit for you. Deploy it to enthrall your audience and increase your presentation threshold with the right graphics, images, and structure. Portray your ideas and vision using twelve slides included in this complete deck. This template is suitable for expert discussion meetings presenting your views on the topic. With a variety of slides having the same thematic representation, this template can be regarded as a complete package. It employs some of the best design practices, so everything is well-structured. Not only this, it responds to all your needs and requirements by quickly adapting itself to the changes you make. This PPT slideshow is available for immediate download in PNG, JPG, and PDF formats, further enhancing its usability. Grab it by clicking the download button.
-
 Derivative market content collateralization product liquidity risk average return
Deliver a lucid presentation by utilizing this Derivative Market Content Collateralization Product Liquidity Risk Average Return. Use it to present an overview of the topic with the right visuals, themes, shapes, and graphics. This is an expertly designed complete deck that reinforces positive thoughts and actions. Use it to provide visual cues to your audience and help them make informed decisions. A wide variety of discussion topics can be covered with this creative bundle such as Collateralization, Product, Liquidity Risk, Average Return. All the twelve slides are available for immediate download and use. They can be edited and modified to add a personal touch to the presentation. This helps in creating a unique presentation every time. Not only that, with a host of editable features, this presentation can be used by any industry or business vertical depending on their needs and requirements. The compatibility with Google Slides is another feature to look out for in the PPT slideshow.
-
 Agile supply chain average distribution statistical analysis processing sales
If you require a professional template with great design, then this Agile Supply Chain Average Distribution Statistical Analysis Processing Sales is an ideal fit for you. Deploy it to enthrall your audience and increase your presentation threshold with the right graphics, images, and structure. Portray your ideas and vision using twelve slides included in this complete deck. This template is suitable for expert discussion meetings presenting your views on the topic. With a variety of slides having the same thematic representation, this template can be regarded as a complete package. It employs some of the best design practices, so everything is well-structured. Not only this, it responds to all your needs and requirements by quickly adapting itself to the changes you make. This PPT slideshow is available for immediate download in PNG, JPG, and PDF formats, further enhancing its usability. Grab it by clicking the download button.
-
 Before and after state equipment average resources innovation plan
If you require a professional template with great design, then this Before And After State Equipment Average Resources Innovation Plan is an ideal fit for you. Deploy it to enthrall your audience and increase your presentation threshold with the right graphics, images, and structure. Portray your ideas and vision using Equipment, Average, Resources, Innovation, Plan slides included in this complete deck. This template is suitable for expert discussion meetings presenting your views on the topic. With a variety of slides having the same thematic representation, this template can be regarded as a complete package. It employs some of the best design practices, so everything is well-structured. Not only this, it responds to all your needs and requirements by quickly adapting itself to the changes you make. This PPT slideshow is available for immediate download in PNG, JPG, and PDF formats, further enhancing its usability. Grab it by clicking the download button.
-
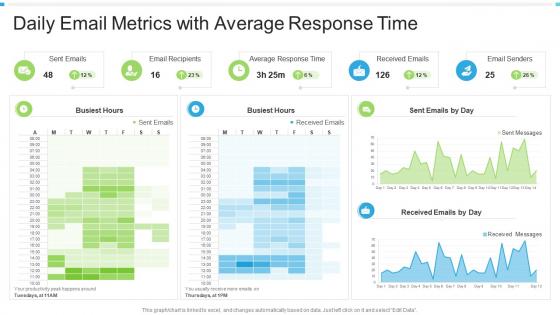 Daily email metrics with average response time
Introducing our Daily Email Metrics With Average Response Time set of slides. The topics discussed in these slides are Email Recipients, Average Response Time, Received Emails. This is an immediately available PowerPoint presentation that can be conveniently customized. Download it and convince your audience.
-
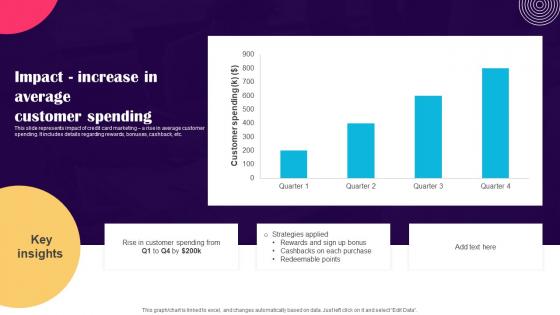 Impact Increase In Average Customer Promotion Strategies To Advertise Credit Strategy SS V
This slide represents impact of credit card marketing a rise in average customer spending. It includes details regarding rewards, bonuses, cashback, etc. Deliver an outstanding presentation on the topic using this Impact Increase In Average Customer Promotion Strategies To Advertise Credit Strategy SS V. Dispense information and present a thorough explanation of Increase, Customer, Average using the slides given. This template can be altered and personalized to fit your needs. It is also available for immediate download. So grab it now.
-
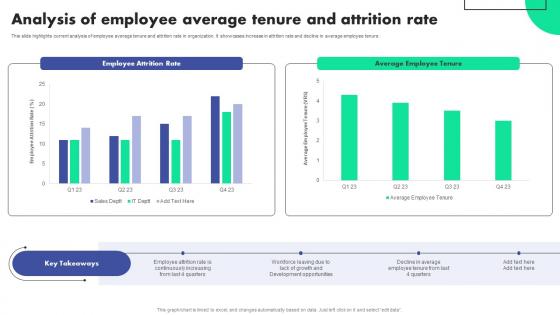 Analysis Of Employee Average Tenure Succession Planning To Identify Talent And Critical Job Roles
This slide highlights current analysis of employee average tenure and attrition rate in organization. It showcases increase in attrition rate and decline in average employee tenure. Deliver an outstanding presentation on the topic using this Analysis Of Employee Average Tenure Succession Planning To Identify Talent And Critical Job Roles. Dispense information and present a thorough explanation of Development, Opportunities, Growth using the slides given. This template can be altered and personalized to fit your needs. It is also available for immediate download. So grab it now.
-
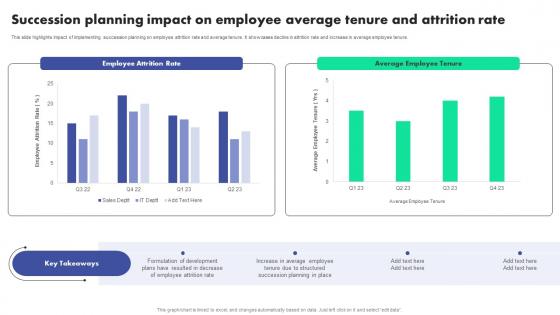 Succession Employee Average Tenure And Attrition Succession Planning To Identify Talent And Critical Job Roles
This slide highlights impact of implementing succession planning on employee attrition rate and average tenure. It showcases decline in attrition rate and increase in average employee tenure. Deliver an outstanding presentation on the topic using this Succession Employee Average Tenure And Attrition Succession Planning To Identify Talent And Critical Job Roles. Dispense information and present a thorough explanation of Succession, Planning, Development using the slides given. This template can be altered and personalized to fit your needs. It is also available for immediate download. So grab it now.
-
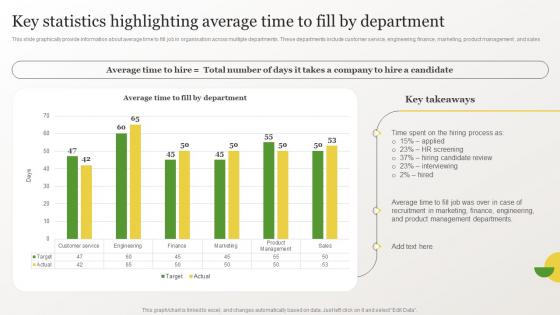 Identifying Gaps In Workplace Key Statistics Highlighting Average Time To Fill By Department
This slide graphically provide information about average time to fill job in organisation across multiple departments.These departments include customer service, engineering, finance, marketing, product management , and sales. Present the topic in a bit more detail with this Identifying Gaps In Workplace Key Statistics Highlighting Average Time To Fill By Department Use it as a tool for discussion and navigation on Hiring Candidate Review, Management Departments This template is free to edit as deemed fit for your organization. Therefore download it now.
-
 Development Courses For Leaders Average Expenditure On Leadership Development Per Person
The following slide showcases the average expenditure on per person basis for leadership development of senior managers, mid level managers, first time managers and potential future leaders. Present the topic in a bit more detail with this Development Courses For Leaders Average Expenditure On Leadership Development Per Person. Use it as a tool for discussion and navigation on Average Expenditure, Leadership Development, Potential Future Leaders. This template is free to edit as deemed fit for your organization. Therefore download it now.
-
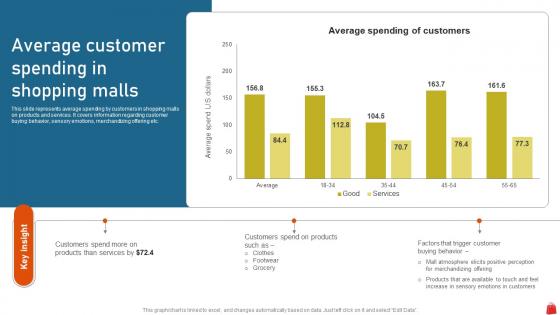 Average Customer Spending In Shopping Malls Execution Of Mall Loyalty Program To Attract Customer MKT SS V
This slide represents average spending by customers in shopping malls on products and services. It covers information regarding customer buying behavior, sensory emotions, merchandizing offering etc. Present the topic in a bit more detail with this Average Customer Spending In Shopping Malls Execution Of Mall Loyalty Program To Attract Customer MKT SS V. Use it as a tool for discussion and navigation on Average Spending Of Customers. This template is free to edit as deemed fit for your organization. Therefore download it now.
-
 Global Beauty And Personal Care Industry Average Revenue Beauty And Personal Care IR SS
This slide covers average revenue generated by global beauty and personal care industry. It involves comparative analysis on basis on revenue associated by offline and online stores. Present the topic in a bit more detail with this Global Beauty And Personal Care Industry Average Revenue Beauty And Personal Care IR SS. Use it as a tool for discussion and navigation on Global beauty, personal care industry, average revenue. This template is free to edit as deemed fit for your organization. Therefore download it now.
-
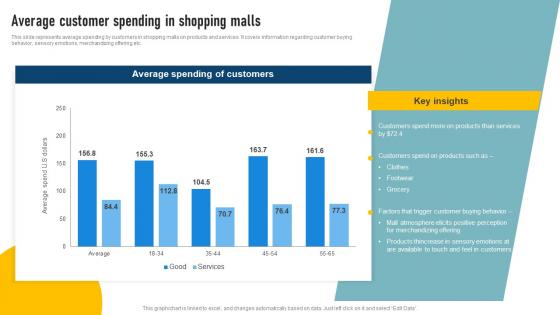 Effective Shopping Centre Average Customer Spending In Shopping Malls MKT SS V
This slide represents average spending by customers in shopping malls on products and services. It covers information regarding customer buying behavior, sensory emotions, merchandizing offering etc. Present the topic in a bit more detail with this Effective Shopping Centre Average Customer Spending In Shopping Malls MKT SS V Use it as a tool for discussion and navigation on Merchandizing Offering, Feel In Customers. This template is free to edit as deemed fit for your organization. Therefore download it now.
-
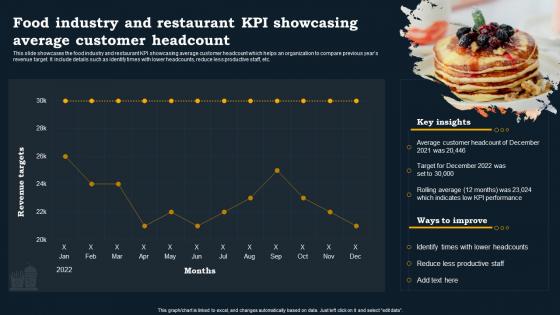 Food Industry And Restaurant KPI Showcasing Average Customer Headcount
This slide showcases the food industry and restaurant KPI showcasing average customer headcount which helps an organization to compare previous years revenue target. It include details such as identify times with lower headcounts, reduce less productive staff, etc. Presenting our well structured Food Industry And Restaurant KPI Showcasing Average Customer Headcount. The topics discussed in this slide are Customer, Industry, Average. This is an instantly available PowerPoint presentation that can be edited conveniently. Download it right away and captivate your audience.
-
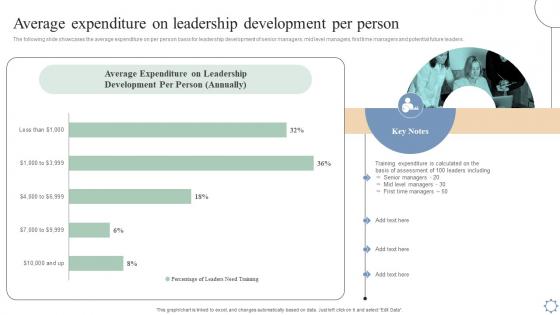 Average Expenditure On Leadership And Management Development Programs
The following slide showcases the average expenditure on per person basis for leadership development of senior managers, mid level managers, first time managers and potential future leaders.Deliver an outstanding presentation on the topic using this Average Expenditure On Leadership And Management Development Programs. Dispense information and present a thorough explanation of Senior managers, Mid level managers, First time managers using the slides given. This template can be altered and personalized to fit your needs. It is also available for immediate download. So grab it now.
-
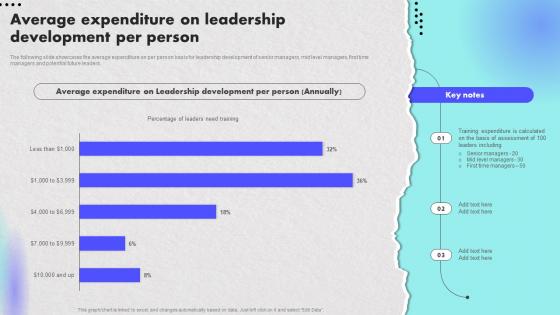 Average Expenditure On Leadership Creating An Effective Leadership Training
The following slide showcases the average expenditure on per person basis for leadership development of senior managers, mid level managers, first time managers and potential future leaders.Present the topic in a bit more detail with this Average Expenditure On Leadership Creating An Effective Leadership Training. Use it as a tool for discussion and navigation on Average Expenditure, Training Expenditure, Level Managers. This template is free to edit as deemed fit for your organization. Therefore download it now.
-
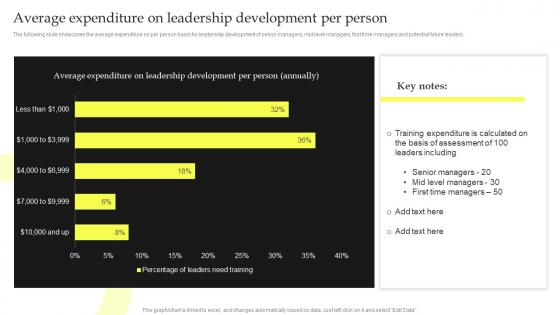 Average Expenditure On Leadership Development Per Top Leadership Skill Development Training
The following slide showcases the average expenditure on per person basis for leadership development of senior managers, mid level managers, first time managers and potential future leaders. Deliver an outstanding presentation on the topic using this Average Expenditure On Leadership Development Per Top Leadership Skill Development Training. Dispense information and present a thorough explanation of Expenditure, Training, Managers using the slides given. This template can be altered and personalized to fit your needs. It is also available for immediate download. So grab it now.
-
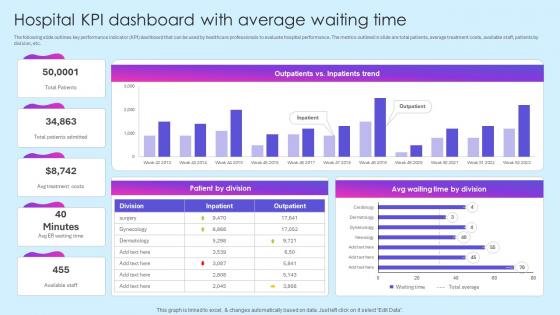 Hospital Kpi Dashboard With Average Healthcare Marketing Ideas To Boost Sales Strategy SS V
The following slide outlines key performance indicator KPI dashboard that can be used by healthcare professionals to evaluate hospital performance. The metrics outlined in slide are total patients, average treatment costs, available staff, patients by division, etc. Deliver an outstanding presentation on the topic using this Hospital Kpi Dashboard With Average Healthcare Marketing Ideas To Boost Sales Strategy SS V. Dispense information and present a thorough explanation of Dashboard, Performance, Professionals using the slides given. This template can be altered and personalized to fit your needs. It is also available for immediate download. So grab it now.
-
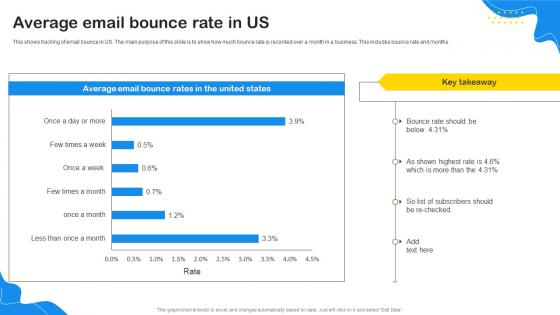 Average Email Bounce Rate In US
This shows tracking of email bounce in US. The main purpose of this slide is to show how much bounce rate is recorded over a month in a business. This includes bounce rate and months. Introducing our Average Email Bounce Rate In US set of slides. The topics discussed in these slides are Email, Bounce, Average. This is an immediately available PowerPoint presentation that can be conveniently customized. Download it and convince your audience.
-
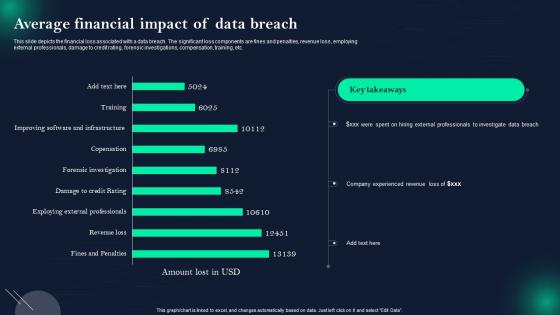 Data Breach Prevention Average Financial Impact Of Data Breach
This slide depicts the financial loss associated with a data breach. The significant loss components are fines and penalties, revenue loss, employing external professionals, damage to credit rating, forensic investigations, compensation, training, etc. Present the topic in a bit more detail with this Data Breach Prevention Average Financial Impact Of Data Breach. Use it as a tool for discussion and navigation on Financial Loss Associated, Fines And Penalties, External Professionals, Damage To Credit Rating, Forensic Investigations, Compensation. This template is free to edit as deemed fit for your organization. Therefore download it now.
-
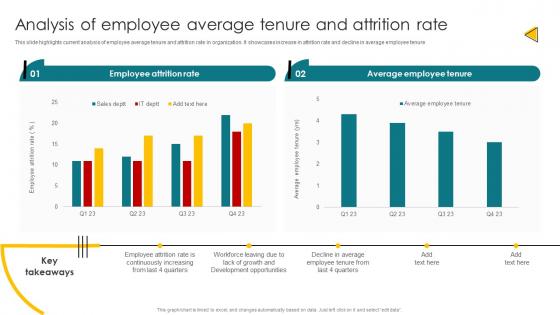 Analysis Of Employee Average Tenure And Attrition Rate Talent Management And Succession
This slide highlights current analysis of employee average tenure and attrition rate in organization. It showcases increase in attrition rate and decline in average employee tenure. Present the topic in a bit more detail with this Analysis Of Employee Average Tenure And Attrition Rate Talent Management And Succession. Use it as a tool for discussion and navigation on Employee Attrition Rate, Average Employee Tenure, Analysis. This template is free to edit as deemed fit for your organization. Therefore download it now.
-
 Succession Planning Impact On Employee Average Tenure Talent Management And Succession
This slide highlights impact of implementing succession planning on employee attrition rate and average tenure. It showcases decline in attrition rate and increase in average employee tenure. Present the topic in a bit more detail with this Succession Planning Impact On Employee Average Tenure Talent Management And Succession. Use it as a tool for discussion and navigation on Employee Attrition Rate, Average Employee Tenure, Succession Planning. This template is free to edit as deemed fit for your organization. Therefore download it now.
-
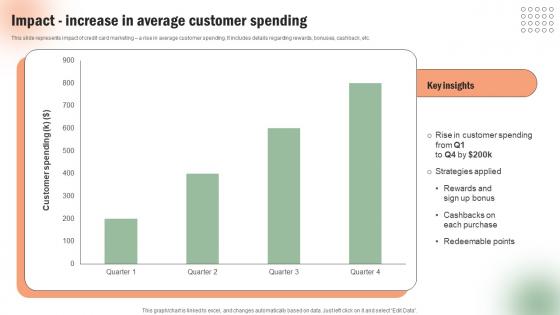 Impact Increase In Average Customer Execution Of Targeted Credit Card Promotional Strategy SS V
This slide represents impact of credit card marketing a rise in average customer spending. It includes details regarding rewards, bonuses, cashback, etc. Deliver an outstanding presentation on the topic using this Impact Increase In Average Customer Execution Of Targeted Credit Card Promotional Strategy SS V. Dispense information and present a thorough explanation of Increase, Average, Spending using the slides given. This template can be altered and personalized to fit your needs. It is also available for immediate download. So grab it now.
-
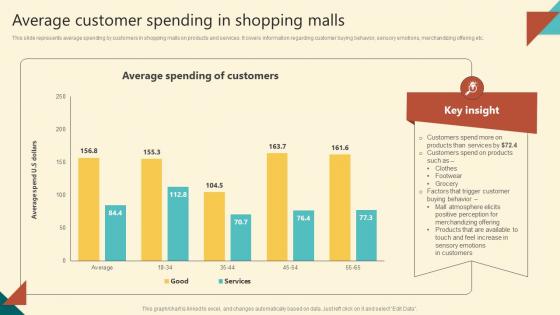 Successful Execution Average Customer Spending In Shopping Malls MKT SS V
This slide represents average spending by customers in shopping malls on products and services. It covers information regarding customer buying behavior, sensory emotions, merchandizing offering etc. Deliver an outstanding presentation on the topic using this Successful Execution Average Customer Spending In Shopping Malls MKT SS V Dispense information and present a thorough explanation of Customers Spend On Products, Trigger Customer using the slides given. This template can be altered and personalized to fit your needs. It is also available for immediate download. So grab it now.
-
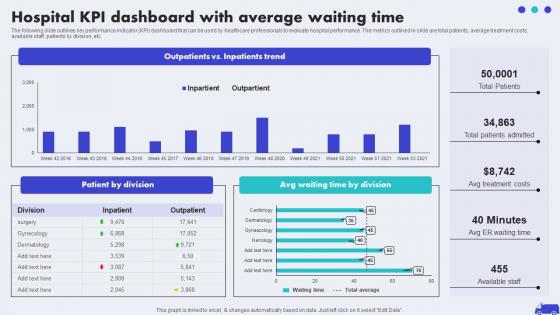 Hospital KPI Dashboard With Average Waiting Hospital Marketing Plan To Improve Patient Strategy SS V
The following slide outlines key performance indicator KPI dashboard that can be used by healthcare professionals to evaluate hospital performance. The metrics outlined in slide are total patients, average treatment costs, available staff, patients by division, etc. Deliver an outstanding presentation on the topic using this Hospital KPI Dashboard With Average Waiting Hospital Marketing Plan To Improve Patient Strategy SS V. Dispense information and present a thorough explanation of Patient By Division, Time By Division using the slides given. This template can be altered and personalized to fit your needs. It is also available for immediate download. So grab it now.
-
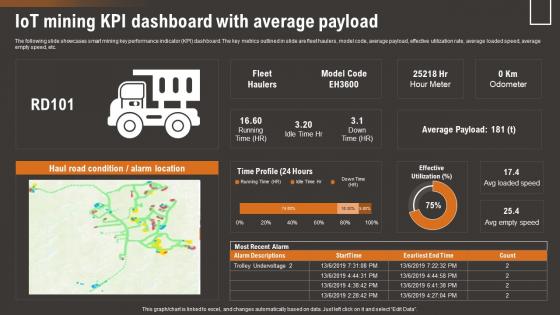 IoT Mining Kpi Dashboard With Average How IoT Technology Is Transforming IoT SS
The following slide showcases smart mining key performance indicator KPI dashboard. The key metrics outlined in slide are fleet haulers, model code, average payload, effective utilization rate, average loaded speed, average empty speed, etc.Present the topic in a bit more detail with this IoT Mining Kpi Dashboard With Average How IoT Technology Is Transforming IoT SS. Use it as a tool for discussion and navigation on Iot Mining Kpi Dashboard, Average Payload. This template is free to edit as deemed fit for your organization. Therefore download it now.
-
 Hospital KPI Dashboard With Average Building Brand In Healthcare Strategy SS V
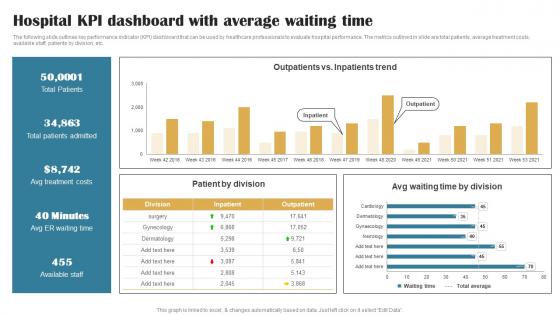
The following slide outlines key performance indicator KPI dashboard that can be used by healthcare professionals to evaluate hospital performance. The metrics outlined in slide are total patients, average treatment costs, available staff, patients by division, etc. Deliver an outstanding presentation on the topic using this Hospital KPI Dashboard With Average Building Brand In Healthcare Strategy SS V. Dispense information and present a thorough explanation of Average, Patients, Treatment using the slides given. This template can be altered and personalized to fit your needs. It is also available for immediate download. So grab it now.
-
 Average Customer Spending In Mall Event Marketing To Drive MKT SS V
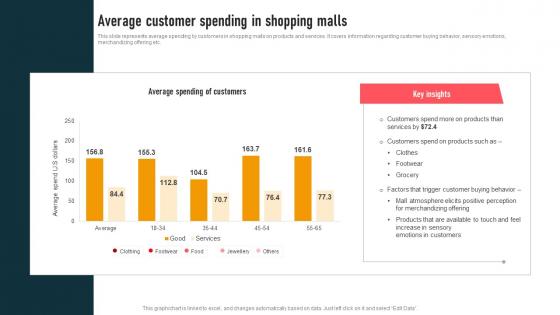
This slide represents average spending by customers in shopping malls on products and services. It covers information regarding customer buying behavior, sensory emotions,merchandizing offering etc.Present the topic in a bit more detail with this Average Customer Spending In Mall Event Marketing To Drive MKT SS V Use it as a tool for discussion and navigation on Customer Buying, Mall Atmosphere, Merchandizing Offering This template is free to edit as deemed fit for your organization. Therefore download it now.
-
 Hospital KPI Dashboard With Average Waiting Time Introduction To Healthcare Marketing Strategy SS V
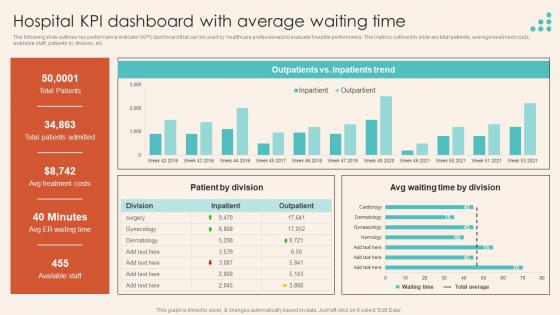
The following slide outlines key performance indicator KPI dashboard that can be used by healthcare professionals to evaluate hospital performance. The metrics outlined in slide are total patients, average treatment costs, available staff, patients by division, etc. Present the topic in a bit more detail with this Hospital KPI Dashboard With Average Waiting Time Introduction To Healthcare Marketing Strategy SS V. Use it as a tool for discussion and navigation on Patient By Division. This template is free to edit as deemed fit for your organization. Therefore download it now.
-
 Food And Beverages Starbucks Product Price Comparison With Average Market Rate CP SS V
Mentioned slide provides insights into differences between Starbucks product pricing with average industry prices. It includes products such as cappuccino, Frappuccino, iced chai tea latte, hot chocolate, iced coffee, etc. Present the topic in a bit more detail with this Food And Beverages Starbucks Product Price Comparison With Average Market Rate CP SS V Use it as a tool for discussion and navigation on Roast Coffee Pricing, Price Variance, Price Variation This template is free to edit as deemed fit for your organization. Therefore download it now.
-
 Impact Increase In Average Customer Spending Introduction Of Effective Strategy SS V
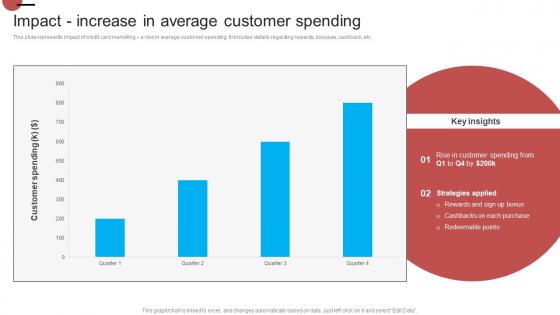
This slide represents impact of credit card marketing a rise in average customer spending. It includes details regarding rewards, bonuses, cashback, etc. Present the topic in a bit more detail with this Impact Increase In Average Customer Spending Introduction Of Effective Strategy SS V. Use it as a tool for discussion and navigation on Increase In Average, Customer Spending. This template is free to edit as deemed fit for your organization. Therefore download it now.
-
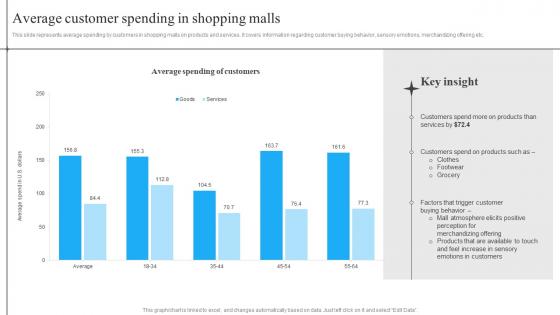 Average Customer Spending In Shopping Malls In Mall Advertisement Strategies To Enhance MKT SS V
This slide represents average spending by customers in shopping malls on products and services. It covers information regarding customer buying behavior, sensory emotions, merchandizing offering etc. Present the topic in a bit more detail with this Average Customer Spending In Shopping Malls In Mall Advertisement Strategies To Enhance MKT SS V. Use it as a tool for discussion and navigation on Average Spending Of Customers. This template is free to edit as deemed fit for your organization. Therefore download it now.
-
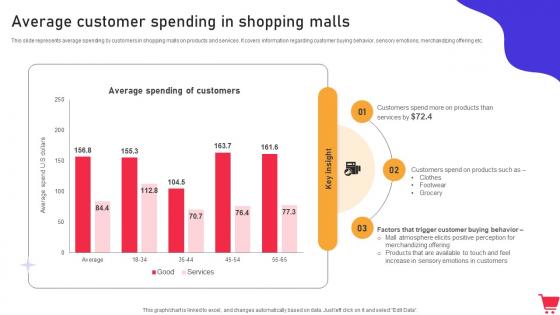 Average Customer Spending In Shopping Malls In Mall Promotion Campaign To Foster MKT SS V
This slide represents average spending by customers in shopping malls on products and services. It covers information regarding customer buying behavior, sensory emotions, merchandizing offering etc. Present the topic in a bit more detail with this Average Customer Spending In Shopping Malls In Mall Promotion Campaign To Foster MKT SS V. Use it as a tool for discussion and navigation on Average Spending Of Customers. This template is free to edit as deemed fit for your organization. Therefore download it now.
-
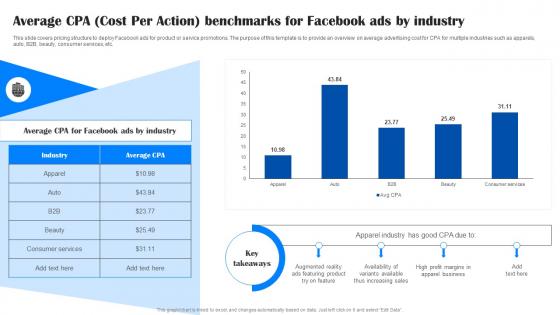 Comprehensive Guide To Facebook Average CPA Cost Per Action Benchmarks For Facebook MKT SS
This slide covers pricing structure to deploy Facebook ads for product or service promotions. The purpose of this template is to provide an overview on average advertising cost for CPA for multiple industries such as apparels, auto, B2B, beauty, consumer services, etc. Present the topic in a bit more detail with this Comprehensive Guide To Facebook Average CPA Cost Per Action Benchmarks For Facebook MKT SS. Use it as a tool for discussion and navigation on Average Cpa Cost Per, Action Benchmarks. This template is free to edit as deemed fit for your organization. Therefore download it now.
-
 Analyzing Average Sales Close Ratio By Industries Top Sales Closing Techniques SA SS
Following slide represents importance and method to examine successful closed deals in various industries that helps to optimize strategy. It includes industry segments such as business services, finance, electronics, real estate, etc. Present the topic in a bit more detail with this Analyzing Average Sales Close Ratio By Industries Top Sales Closing Techniques SA SS. Use it as a tool for discussion and navigation on Analyzing Average Sales, Close Ratio By Industries. This template is free to edit as deemed fit for your organization. Therefore download it now.
-
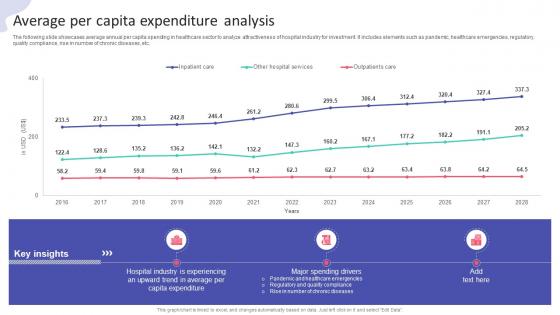 Average Per Capita Expenditure Analysis Hospital Startup Business Plan Revolutionizing
The following slide showcases average annual per capita spending in healthcare sector to analyze attractiveness of hospital industry for investment. It includes elements such as pandemic, healthcare emergencies, regulatory, quality compliance, rise in number of chronic diseases, etc. Present the topic in a bit more detail with this Average Per Capita Expenditure Analysis Hospital Startup Business Plan Revolutionizing. Use it as a tool for discussion and navigation on Average Per Capita, Expenditure Analysis. This template is free to edit as deemed fit for your organization. Therefore download it now.
-
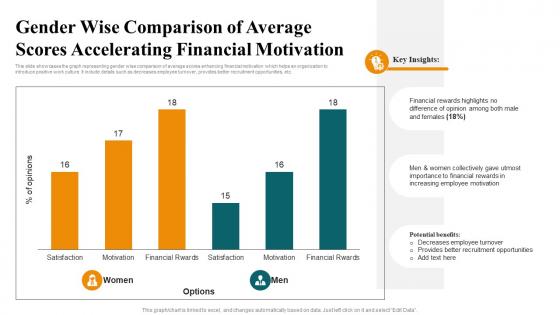 Gender Wise Comparison Of Average Scores Accelerating Financial Motivation
This slide showcases the graph representing gender wise comparison of average scores enhancing financial motivation which helps an organization to introduce positive work culture. It include details such as decreases employee turnover, provides better recruitment opportunities, etc. Introducing our Gender Wise Comparison Of Average Scores Accelerating Financial Motivation set of slides. The topics discussed in these slides are Motivation, Financial Rwards, Satisfaction.This is an immediately available PowerPoint presentation that can be conveniently customized. Download it and convince your audience.
-
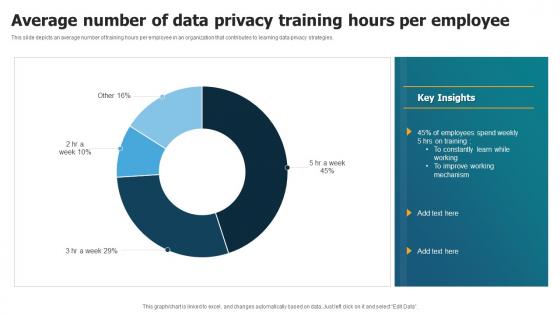 Average Number Of Data Privacy Training Hours Per Employee
This slide depicts an average number of training hours per employee in an organization that contributes to learning data privacy strategies. Introducing our Average Number Of Data Privacy Training Hours Per Employee set of slides. The topics discussed in these slides are Average Number, Training Hours Per Employee. This is an immediately available PowerPoint presentation that can be conveniently customized. Download it and convince your audience.
-
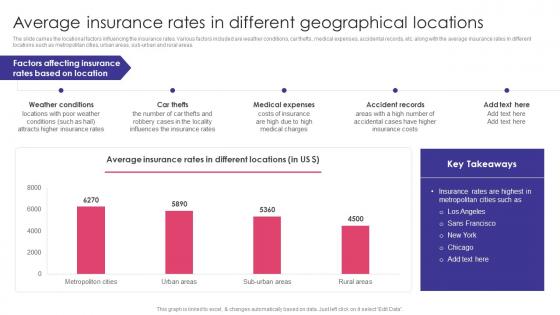 Average Insurance Rates In Different Geographical Locations Auto Insurance Policy Comprehensive Guide
The slide carries the locational factors influencing the insurance rates. Various factors included are weather conditions, car thefts, medical expenses, accidental records, etc. along with the average insurance rates in different locations such as metropolitan cities, urban areas, sub urban and rural areas. Deliver an outstanding presentation on the topic using this Average Insurance Rates In Different Geographical Locations Auto Insurance Policy Comprehensive Guide Dispense information and present a thorough explanation of Medical Expenses, Car Thefts, Weather Conditions using the slides given. This template can be altered and personalized to fit your needs. It is also available for immediate download. So grab it now.
-
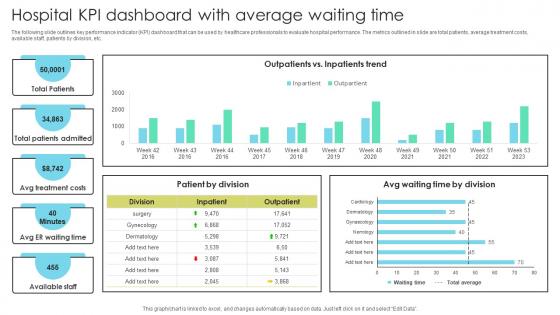 Hospital KPI Dashboard Average Waiting Increasing Patient Volume With Healthcare Strategy SS V
The following slide outlines key performance indicator KPI dashboard that can be used by healthcare professionals to evaluate hospital performance. The metrics outlined in slide are total patients, average treatment costs, available staff, patients by division, etc. Present the topic in a bit more detail with this Hospital KPI Dashboard Average Waiting Increasing Patient Volume With Healthcare Strategy SS V. Use it as a tool for discussion and navigation on Patients Admitted, Treatment Costs, Total Patients. This template is free to edit as deemed fit for your organization. Therefore download it now.
-
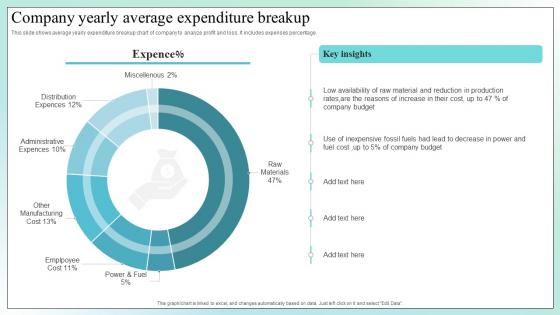 Company Yearly Average Expenditure Breakup
This slide shows average yearly expenditure breakup chart of company to analyze profit and loss. It includes expenses percentage Presenting our well structured Company Yearly Average Expenditure Breakup The topics discussed in this slide are Company Budget, Reduction In Production, Decrease In Power. This is an instantly available PowerPoint presentation that can be edited conveniently. Download it right away and captivate your audience.
-
 Data Breach Response Plan Average Financial Impact Of Data Breach
This slide depicts the financial loss associated with a data breach. The significant loss components are fines and penalties, revenue loss, employing external professionals, damage to credit rating, forensic investigations, compensation, training, etc. Deliver an outstanding presentation on the topic using this Data Breach Response Plan Average Financial Impact Of Data Breach. Dispense information and present a thorough explanation of Fines And Penalties, Revenue Loss, Employing External Professionals, Forensic Investigations using the slides given. This template can be altered and personalized to fit your needs. It is also available for immediate download. So grab it now.
-
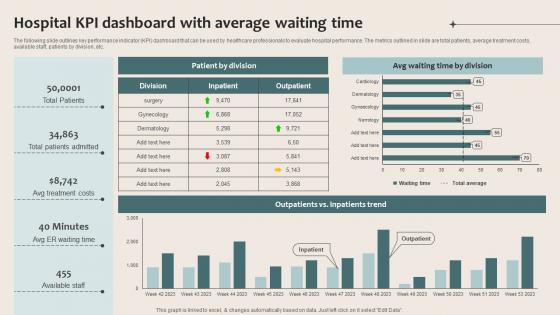 Healthcare Marketing Hospital Kpi Dashboard With Average Waiting Time Strategy SS V
The following slide outlines key performance indicator KPI dashboard that can be used by healthcare professionals to evaluate hospital performance. The metrics outlined in slide are total patients, average treatment costs, available staff, patients by division, etc. Deliver an outstanding presentation on the topic using this Healthcare Marketing Hospital Kpi Dashboard With Average Waiting Time Strategy SS V Dispense information and present a thorough explanation of Patient By Division, Waiting Time By Division, Inpatients Trend using the slides given. This template can be altered and personalized to fit your needs. It is also available for immediate download. So grab it now.
-
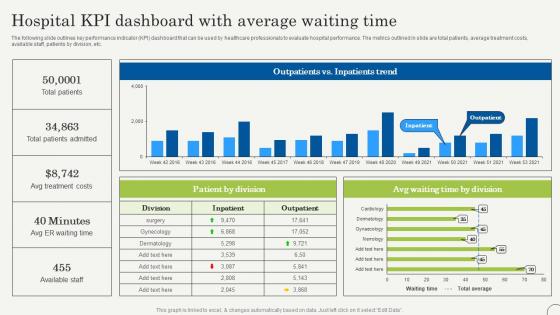 Hospital KPI Dashboard With Average Waiting Time Strategic Plan To Promote Strategy SS V
The following slide outlines key performance indicator KPI dashboard that can be used by healthcare professionals to evaluate hospital performance. The metrics outlined in slide are total patients, average treatment costs, available staff, patients by division, etc. Deliver an outstanding presentation on the topic using this Hospital KPI Dashboard With Average Waiting Time Strategic Plan To Promote Strategy SS V. Dispense information and present a thorough explanation of Treatment, Waiting, Available using the slides given. This template can be altered and personalized to fit your needs. It is also available for immediate download. So grab it now.
-
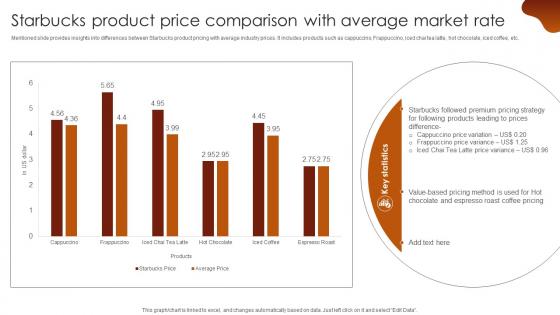 Starbucks Product Price Comparison With Average Luxury Coffee Brand Company Profile CP SS V
Mentioned slide provides insights into differences between Starbucks product pricing with average industry prices. It includes products such as cappuccino, Frappuccino, iced chai tea latte, hot chocolate, iced coffee, etc. Deliver an outstanding presentation on the topic using this Starbucks Product Price Comparison With Average Luxury Coffee Brand Company Profile CP SS V. Dispense information and present a thorough explanation of Starbucks Product Price, Comparison With Average using the slides given. This template can be altered and personalized to fit your needs. It is also available for immediate download. So grab it now.
-
 Hospital KPI Dashboard With Average Waiting Time Promotional Plan Strategy SS V
The following slide outlines key performance indicator KPI dashboard that can be used by healthcare professionals to evaluate hospital performance. The metrics outlined in slide are total patients, average treatment costs, available staff, patients by division, etc. Present the topic in a bit more detail with this Hospital KPI Dashboard With Average Waiting Time Promotional Plan Strategy SS V Use it as a tool for discussion and navigation on Outpatients, Inpatients Trend, Patient By Division This template is free to edit as deemed fit for your organization. Therefore download it now.
-
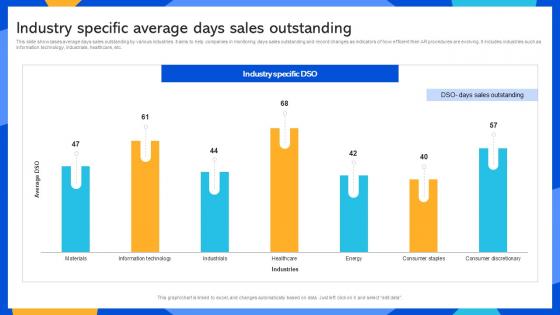 Industry Specific Average Days Sales Outstanding
Introducing our Industry Specific Average Days Sales Outstanding set of slides. The topics discussed in these slides are Information, Technology, Industrials. This is an immediately available PowerPoint presentation that can be conveniently customized. Download it and convince your audience.
-
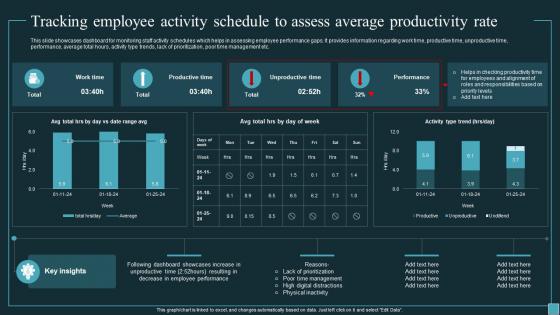 Implementing Workforce Analytics Tracking Employee Activity Schedule To Assess Average Data Analytics SS
This slide showcases dashboard for monitoring staff activity schedules which helps in assessing employee performance gaps. It provides information regarding work time, productive time, unproductive time, performance, average total hours, activity type trends, lack of prioritization, poor time management etc. Present the topic in a bit more detail with this Implementing Workforce Analytics Tracking Employee Activity Schedule To Assess Average Data Analytics SS. Use it as a tool for discussion and navigation on Tracking Employee Activity Schedule, Assess Average Productivity Rate, Lack Of Prioritization, Poor Time Management. This template is free to edit as deemed fit for your organization. Therefore download it now.
-
 Average cost second home insurance ppt powerpoint presentation inspiration cpb
Presenting our Average Cost Second Home Insurance Ppt Powerpoint Presentation Inspiration Cpb PowerPoint template design. This PowerPoint slide showcases four stages. It is useful to share insightful information on Average Cost Second Home Insurance This PPT slide can be easily accessed in standard screen and widescreen aspect ratios. It is also available in various formats like PDF, PNG, and JPG. Not only this, the PowerPoint slideshow is completely editable and you can effortlessly modify the font size, font type, and shapes according to your wish. Our PPT layout is compatible with Google Slides as well, so download and edit it as per your knowledge.
-
 Average closing costs refinance ppt powerpoint presentation model graphics design cpb
Presenting Average Closing Costs Refinance Ppt Powerpoint Presentation Model Graphics Design Cpb slide which is completely adaptable. The graphics in this PowerPoint slide showcase six stages that will help you succinctly convey the information. In addition, you can alternate the color, font size, font type, and shapes of this PPT layout according to your content. This PPT presentation can be accessed with Google Slides and is available in both standard screen and widescreen aspect ratios. It is also a useful set to elucidate topics like Average Closing Costs Refinance. This well structured design can be downloaded in different formats like PDF, JPG, and PNG. So, without any delay, click on the download button now.
-
 Average down payment house ppt powerpoint presentation ideas example cpb
Presenting our Average Down Payment House Ppt Powerpoint Presentation Ideas Example Cpb PowerPoint template design. This PowerPoint slide showcases three stages. It is useful to share insightful information on Average Down Payment House This PPT slide can be easily accessed in standard screen and widescreen aspect ratios. It is also available in various formats like PDF, PNG, and JPG. Not only this, the PowerPoint slideshow is completely editable and you can effortlessly modify the font size, font type, and shapes according to your wish. Our PPT layout is compatible with Google Slides as well, so download and edit it as per your knowledge.
-
 Calculate average income tax rate ppt powerpoint presentation file slide portrait cpb
Presenting our Calculate Average Income Tax Rate Ppt Powerpoint Presentation File Slide Portrait Cpb PowerPoint template design. This PowerPoint slide showcases five stages. It is useful to share insightful information on Calculate Average Income Tax Rate This PPT slide can be easily accessed in standard screen and widescreen aspect ratios. It is also available in various formats like PDF, PNG, and JPG. Not only this, the PowerPoint slideshow is completely editable and you can effortlessly modify the font size, font type, and shapes according to your wish. Our PPT layout is compatible with Google Slides as well, so download and edit it as per your knowledge.


