


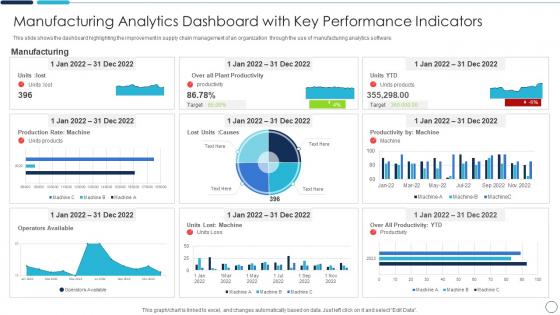
Manufacturing Analytics Dashboard With Key Performance Indicators




Try Before you Buy Download Free Sample Product
 Impress Your
 Audience
 100%
100% Editable
 Save Hours
 of Time


This slide shows the dashboard highlighting the improvement in supply chain management of an organization through the use of manufacturing analytics software.
People who downloaded this PowerPoint presentation also viewed the following :
Manufacturing Analytics Dashboard With Key Performance Indicators with all 7 slides:
Use our Manufacturing Analytics Dashboard With Key Performance Indicators to effectively help you save your valuable time. They are readymade to fit into any presentation structure.





FAQs for Manufacturing Analytics Dashboard With
Dude, manufacturing analytics is a game changer. You get real-time data on everything happening on your factory floor - spot bottlenecks before they kill your margins. Quality control becomes way easier since you can predict equipment failures and catch products going off-spec early. The predictive maintenance piece alone will save you a fortune in downtime. Better inventory management too, plus you can actually schedule based on real performance data instead of guessing. My buddy started with just one line and the ROI was obvious within months. Worth trying for sure.
Predictive analytics is basically like having a crystal ball for your business problems. You'll catch equipment failures, supply chain mess-ups, and demand spikes before they actually hit. Super useful for maintenance scheduling too – way better than waiting for things to break. I've seen companies save tons just by predicting when machines need attention. Quality issues, workforce planning, even inventory stuff... honestly once you get the hang of it, you start seeing opportunities everywhere. My advice? Pick one problem area first and see how it goes from there.
Honestly, data viz is what makes all those manufacturing numbers actually make sense. Charts and dashboards beat staring at endless spreadsheets any day - you'll catch production issues and trends way faster. Real-time KPIs on a visual dashboard? Game changer. Your team can spot bottlenecks without being data experts. Heat maps are particularly clutch for identifying problem areas quickly. I'd probably start simple though - just basic line charts for your main metrics, then expand once you get comfortable. Way better than drowning in rows of data that tell you nothing at first glance.
So basically you're putting sensors everywhere to watch your machines 24/7. Temperature, vibration, speed - all that gets streamed to your analytics in real time. Way better than finding out at the end of the shift that something was overheating for hours, you know? You'll catch problems before they turn into expensive disasters. Honestly, the visibility alone is worth it - you finally see what's actually happening vs what's supposed to happen. I'd start small though, just tackle your biggest headaches first with a few sensors and build from there.
Oh man, the data stuff is brutal - your old machines probably can't even talk to modern systems. Quality's a mess too since manufacturing data comes out all wonky and incomplete. Honestly the worst part might be getting your operators on board. They're already swamped and now you want them learning new tools? Budget's tight obviously, and good luck proving ROI right away. My advice? Pick one line, make it work there first. Way less painful than trying to do everything at once and watching it all fall apart.
Honestly, ML is a game-changer for catching quality problems. It picks up on patterns in your production data that you'd never notice - temperature shifts, pressure changes, vibration weirdness, visual defects, all that stuff. The real magic happens when it starts predicting issues before they blow up, instead of just reacting after the fact. Way better than random sampling or waiting for angry customers to call. My advice? Figure out what quality problems cost you the most money (that part's usually pretty obvious) and start feeding that data into an anomaly detection model. You'll get alerts the second something goes sideways.
Start with production stuff - machine performance, throughput, quality metrics. That's where the money is. Equipment sensors are huge for catching problems before they break everything. Supply chain data sounds boring as hell but trust me, you don't want to be scrambling for parts at 2am. Energy usage and workforce productivity matter too, though honestly? Just pick whatever data you actually trust and can access easily. I'd rather work with solid info from three places than sketchy numbers from everywhere. Quality beats quantity every time.
So basically, manufacturing analytics lets you see what's happening across your whole supply chain in real-time. Super helpful for catching bottlenecks before they screw you over. I've seen teams completely transform how they predict demand - honestly that alone makes it worth it. You can track which suppliers are reliable, figure out optimal inventory levels, spot quality issues early. No more playing guessing games with reorders, which used to drive me crazy at my last job. My advice? Pick your biggest headache area first and start there.
Honestly, start with your sensor calibration - get those on a consistent schedule and make sure all your data formats match up. Bad data caught early will save you so much pain later, so set up some automated rules to flag weird outliers or missing stuff right away. You'll want regular audits too. Make someone actually own each data source (otherwise nobody takes responsibility, you know?). Document where everything comes from so when things break, you can trace it back. Oh, and focus on your most important KPIs first - don't try to fix everything at once.
Yeah, industries totally customize their analytics based on what keeps them up at night. Auto companies obsess over quality control and predicting defects - makes sense since recalls are a nightmare. Electronics folks focus on yield rates and keeping things from overheating because one bad batch can tank your profits. Food companies? They're all about tracing contamination and figuring out shelf life. Honestly, generic dashboards are pretty useless. You've gotta start with whatever metrics actually matter in your space, then build around those specific headaches.
Honestly, it totally depends on your setup, but I'd start with a solid MES system as your base. Then grab something like Tableau or Power BI for visualizing everything. IoT sensors are where the magic happens though - once you connect all your machines, the data insights are pretty wild. IBM Watson IoT or Azure work great for predictive maintenance stuff. Oh, and don't skip ERP integration since that's where all your business context sits. My advice? Pick one production line first, prove it works and makes money, then expand from there. Way less risky that way.
So analytics basically lets you see where you're bleeding money in real-time - material waste, energy spikes, production screwups. Pretty eye-opening stuff. Companies I know have cut waste by 20-30% just from finally seeing what's actually happening on their floor. You can tweak machine settings to reduce scrap, catch equipment issues before they turn into material-wasting nightmares. Plus it helps with predictive maintenance and not overordering supplies. Honestly, just pick one sketchy area and throw some sensors at it first. You'll probably be shocked at the baseline data.
Honestly, advanced analytics is a game-changer for manufacturing. Think of it as your data detective - it takes all that sensor info from your machines and actually tells you what's going on. You'll catch equipment failures before they happen, which saves you tons of headaches. Plus you can tweak production schedules on the fly and spot quality problems way sooner. I've seen companies cut so much waste once they figure out their data patterns. My advice? Start with something simple like monitoring your most important machine, then build from there. No point overwhelming yourself right away.
Honestly, your analytics mean nothing if people can't read them properly. I've watched companies blow serious cash on these gorgeous dashboards that just sit there collecting digital dust because nobody knows what they're looking at. Training your team on data literacy is huge - they need to spot patterns and turn those numbers into real changes. Otherwise you're just staring at fancy graphs all day. Start with the basics first, then work up to the complex stuff. Oh, and make sure they're actually comfortable with it - can't tell you how many times I've seen people just completely ignore data because it feels overwhelming.
Dude, manufacturing analytics is about to get crazy predictive. Instead of just showing what already happened, AI will catch equipment failures weeks before they actually break down. Edge computing's making everything faster too - your factory systems won't need to wait for the cloud anymore. Digital twins are finally moving past the buzzword phase and actually optimizing production lines. Oh, and sustainability tracking? That's becoming required, not optional, with all these new regulations. Honestly, if you don't have clean data infrastructure already, you're gonna get left behind. Companies with their data sorted will own this space.
-
“As you have innovative ideas and they are all customizable, this saves a huge chunk of your time to prepare well-read presentations.”
-
The slides are remarkable with creative designs and interesting information. I am pleased to see how functional and adaptive the design is. Would highly recommend this purchase!