

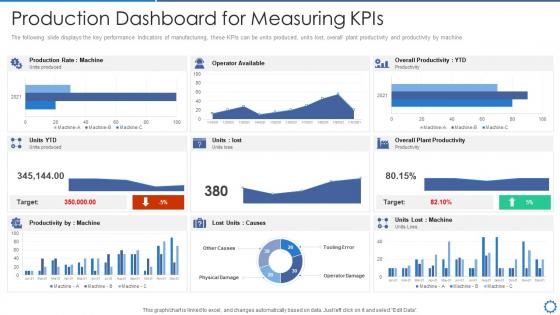
Manufacturing operation best practices dashboard snapshot for measuring kpis




Try Before you Buy Download Free Sample Product
 Impress Your
Audience
 100%
Editable
 Save Hours
of Time


The following slide displays the key performance Indicators of manufacturing, these KPIs can be units produced, units lost, overall plant productivity and productivity by machine
People who downloaded this PowerPoint presentation also viewed the following :
Manufacturing operation best practices dashboard snapshot for measuring kpis with all 7 slides:
Use our Manufacturing Operation Best Practices Dashboard Snapshot For Measuring Kpis to effectively help you save your valuable time. They are readymade to fit into any presentation structure.







FAQs for Manufacturing operation best practices dashboard snapshot
Critical manufacturing KPIs include overall equipment effectiveness (OEE), production efficiency, quality defect rates, inventory turnover, and schedule adherence metrics. These indicators streamline operations by identifying bottlenecks, minimizing waste, and optimizing resource allocation, with many manufacturing organizations finding that real-time visibility ultimately delivers faster decision-making and enhanced competitive advantage.
Real-time data visualization improves manufacturing efficiency by enabling instant identification of bottlenecks, tracking equipment performance metrics, and monitoring quality control parameters as they happen. Through interactive dashboards, manufacturing teams can quickly adjust production schedules, minimize downtime, and optimize resource allocation, with many facilities finding that immediate visibility into operations reduces waste by up to 30%.
Predictive analytics transforms manufacturing KPIs by forecasting equipment failures, demand fluctuations, quality issues, and production bottlenecks before they occur. Through machine learning algorithms and historical data analysis, manufacturers can optimize maintenance schedules, reduce downtime, and improve resource allocation, ultimately delivering proactive decision-making and significant cost savings.
Tailoring manufacturing dashboards involves customizing metrics, visualization depth, and data granularity for each stakeholder's specific responsibilities and decision-making needs. Plant managers require operational efficiency metrics and real-time production data, while executives focus on high-level KPIs like overall equipment effectiveness and cost performance, with many organizations finding that role-based customization significantly enhances strategic decision-making and operational responsiveness.
Cloud-based manufacturing KPI dashboards offer real-time visibility, scalability, remote accessibility, automatic updates, and cost-effective deployment across multiple facilities. These platforms enable manufacturers to monitor production efficiency, quality metrics, and equipment performance from anywhere, while reducing IT infrastructure costs and ensuring seamless integration, ultimately delivering faster decision-making and enhanced operational control.
Ensuring data accuracy in manufacturing KPI dashboards requires implementing automated data collection systems, regular validation protocols, real-time monitoring alerts, and standardized data entry processes across production lines. Manufacturing organizations achieve this by integrating IoT sensors with ERP systems, establishing data governance frameworks, and conducting periodic audits, ultimately delivering reliable insights that enable confident decision-making and operational efficiency.
Top tools for manufacturing KPI dashboards include Tableau, Power BI, QlikView, SAP BusinessObjects, and specialized manufacturing platforms like Wonderware InTouch. These solutions streamline data visualization by integrating real-time production metrics, automating report generation, and enabling cross-departmental collaboration, with many manufacturers finding that comprehensive dashboards ultimately deliver faster decision-making and enhanced operational efficiency.
Manufacturing KPIs should be updated in real-time for critical metrics like production output and quality defects, while strategic indicators can be refreshed daily or weekly. Through automated data integration, manufacturers streamline monitoring across production lines, inventory levels, and equipment performance, with many facilities finding that frequent updates enable faster decision-making and ultimately deliver improved operational efficiency.
OEE measures manufacturing productivity by combining availability, performance, and quality metrics into a single percentage, typically ranging from 40-85% across industries. This comprehensive metric enables manufacturers to identify bottlenecks, minimize downtime, and optimize resource allocation, with many automotive and pharmaceutical companies finding that improving OEE by even 5% delivers significant cost reductions and competitive advantage.
Lean manufacturing impact is measured through KPIs like cycle time reduction, waste elimination percentages, overall equipment effectiveness (OEE), inventory turnover rates, and defect rates. These metrics enable manufacturers to track operational improvements by streamlining production processes, minimizing resource waste, and enhancing quality control, with many organizations finding that consistent KPI monitoring delivers significant cost reductions and competitive advantages.
Common pitfalls include overloading dashboards with excessive metrics, choosing vanity metrics over actionable KPIs, poor visual hierarchy, lack of real-time data integration, and ignoring user-specific needs. These design flaws significantly reduce dashboard effectiveness by creating information overload, delayed decision-making, and user abandonment, with many manufacturing teams finding that streamlined, role-based dashboards deliver faster insights and improved operational efficiency.
Employee engagement metrics can be incorporated through safety incident rates, training completion percentages, employee satisfaction scores, absenteeism rates, and suggestion box participation levels. These metrics enable manufacturers to identify productivity patterns, reduce turnover costs, and enhance workplace culture, with many industrial facilities finding that engaged employees deliver higher quality outputs and improved operational efficiency.
KPI dashboards enhance regulatory compliance by providing real-time monitoring of safety metrics, quality standards, environmental parameters, and audit trails. These systems streamline compliance reporting, automate documentation processes, and enable proactive identification of potential violations, with many manufacturing facilities finding that centralized dashboard visibility significantly reduces compliance risks while accelerating regulatory reporting timelines.
Operational KPIs in manufacturing focus on production efficiency, quality metrics, equipment effectiveness, cycle times, and throughput rates, while financial KPIs track cost performance, profitability, ROI, and budget variances. These complementary metrics work together to provide comprehensive visibility, with operational indicators driving day-to-day improvements and financial measures validating overall business impact and strategic success.
Customer satisfaction metrics in manufacturing can be effectively visualized through real-time dashboards displaying defect rates, delivery performance, quality scores, warranty claims, and customer feedback ratings across product lines. These visualizations enable manufacturers to track satisfaction trends by customer segment, identify quality issues before they escalate, and correlate production metrics with customer outcomes, ultimately delivering improved product quality and stronger customer relationships.
-
Design layout is very impressive.
-
Illustrative design with editable content. Exceptional value for money. Highly pleased with the product.