


Digital Marketing Report Showing Social Media Analytics




Try Before you Buy Download Free Sample Product
 Impress Your
 Audience
 100%
100% Editable
 Save Hours
 of Time


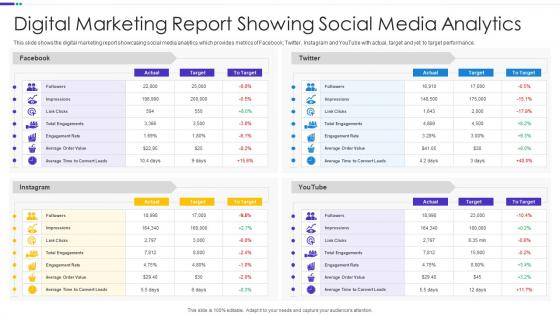
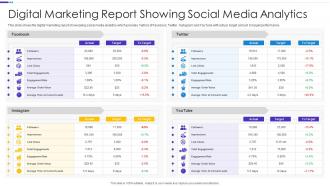
This slide shows the digital marketing report showcasing social media analytics which provides metrics of Facebook, Twitter, Instagram and YouTube with actual, target and yet to target performance.
People who downloaded this PowerPoint presentation also viewed the following :
Digital Marketing Report Showing Social Media Analytics with all 6 slides:
Use our Digital Marketing Report Showing Social Media Analytics to effectively help you save your valuable time. They are readymade to fit into any presentation structure.





FAQs for Digital Marketing Report Showing
Honestly, don't get caught up in vanity metrics like traffic - focus on what actually matters for your wallet. Conversion rate is huge (are people buying?), plus cost per acquisition and return on ad spend. Those tell you if you're making or losing money. Lifetime value is also key since some customers are way more valuable long-term. I'd throw in engagement stuff too - click-through rates, time on site - just to see if your content's hitting right. But seriously, pick like 2-3 max that connect to your actual goals. Otherwise you'll spend forever staring at dashboards instead of fixing what's broken.
Pick one thing to test first - maybe your headline or that CTA button. Split traffic 50/50 and let it run for at least a week, maybe two depending on how much traffic you get. I made the mistake of calling a test early once and totally messed up my results lol. Track conversions, not just clicks - that's where the real money is. Honestly, having enough traffic for solid data is half the battle. Once you've got a clear winner, roll it out and move to the next element. Don't overthink it at first.
Dude, segmentation is what turns your analytics from useless pretty charts into actual money-makers. Split your audience by behavior or demographics, then track each group separately. Your email campaign might tank overall but absolutely kill it with urban millennials - without segments, you'd never know that goldmine exists. Pick 2-3 segments that actually matter to your goals first (don't go crazy with like 20 different groups). You'll spot optimization opportunities everywhere once you start looking at the data this way. Honestly wish I'd figured this out sooner.
Okay so social media analytics are basically tracking how people interact with your stuff - likes, shares, comments, all that. You'll see which posts actually work and what topics get people talking. Comments are honestly like having free focus groups (just way more savage sometimes lol). Check out your best performing posts to figure out what your audience loves, then dive into the demographic stuff to see who's actually following you. Age, location, interests - it's all there. Then just make more content like that and post when people are actually online scrolling through their feeds.
Definitely start with Google Analytics 4 - it's free and handles most of what you need for traffic and user behavior. Hotjar is amazing for heatmaps and watching actual user sessions (I could spend hours just seeing how people click around). Real-time tracking works fine in GA4, though Mixpanel gets way more detailed if you're into that. Oh, and don't forget UTM parameters for social media - otherwise you'll have no clue which posts actually drive traffic. Build your foundation with GA4 first, then add heatmap tools once you figure out what specific problems you're trying to solve.
So predictive analytics takes all your old marketing data and finds patterns to guess what'll happen next. Pretty wild how spot-on it gets, honestly. You can forecast stuff like customer lifetime value or which channels will crush it next quarter. Even predict demand spikes for your products. Feed it good historical data - performance metrics, customer behavior, market trends, all that. Though I'd start small if I were you. Pick something simple like email open rates first. Once you see it working, then go crazy with more complex predictions. Way less overwhelming that way.
You're missing the whole picture if you only look at last-click data. Those display ads might seem useless, but they're probably doing the heavy lifting upfront when people first discover you. Multi-channel attribution shows how all your touchpoints work together – awareness, consideration, the whole thing. Otherwise you'll keep throwing money at bottom-funnel stuff while ignoring what actually gets people in the door. Honestly, most people don't realize how much their "bad performing" channels are actually helping. Set up GA4's data-driven attribution if you haven't. It's not perfect but way better than flying blind.
Look, Google Analytics is basically your secret weapon for figuring out which parts of your marketing actually work vs which ones are just eating your money. You can see exactly how people move through your site and where they bail out. The audience data helps you get smarter about targeting, plus you'll know your real ROI across different channels. I always tell people to set up custom dashboards for the metrics that matter most - saves you from getting lost in all the numbers every time you want a quick check. It's honestly like having superpowers for your campaigns.
Ugh, the vanity metrics trap gets everyone - you're obsessing over page views while your actual sales tank. Another big one? Seeing traffic jump and thinking your campaign's genius, when really it's just holiday shopping season or your competitor screwed up. I'm totally guilty of cherry-picking dates to make reports look amazing. Small sample sizes will mess you up too, especially with A/B tests. You really gotta dig into the why behind everything. Cross-check a few different metrics before you go making any major moves - saves so much headache later.
Set up conversion funnels in your analytics to see where people bail on your site. Track each step from landing page to checkout - the biggest drops show you exactly where things are broken. I swear by this stuff, it's like having x-ray vision for your business. Losing 50% between cart and checkout? Your checkout process sucks. Big drop from product page to cart? Probably a pricing or trust thing. Once you spot these problem areas, test different fixes. Simpler forms, better testimonials, faster loading - whatever makes sense for that specific step.
Honestly, real-time data is a game changer because you can spot issues or wins right when they're happening. Your ad suddenly crashes? You'll know instantly instead of checking next week like "oh great, I just burned $500 on a broken page." Been there, not fun. Set up alerts for your main KPIs so you're not glued to your screen all day. I'd start with conversion rates, cost-per-acquisition, and where your traffic's coming from. When something goes viral, you can actually scale it up while it's hot instead of missing the moment completely.
So basically, correlation analysis shows how your marketing channels play together. Email campaigns might boost your organic search traffic. Social media could drive more direct visits. You'll spot which channels amplify each other and which ones are stealing each other's thunder - honestly, that budget allocation piece is where it gets really valuable. Look for both positive correlations (channels helping each other) and negative ones (competing channels). Yeah, correlation doesn't equal causation, but it's still a solid jumping-off point. Run it monthly though, because seasonal stuff can totally mess with your channel relationships.
Honestly, just be upfront about what data you're grabbing and why. Write your privacy policy like you're talking to actual humans - none of that lawyer-speak nonsense that makes everyone's eyes glaze over. Only collect what you actually need (seriously, why do some apps want your location for a calculator?). Give users real control over their stuff. Lock down whatever data you do have. Put yourself in their shoes - would you be cool with how you're using their info? Start by looking at what you're doing now and make some clear rules for your team to follow.
Honestly, most people are tracking the wrong stuff. You'll want to set up proper attribution in Google Analytics first - connect it to your CRM so you can see what's actually making money vs just getting clicks. UTM parameters on everything! That way you can trace revenue back to specific ads. The real game is comparing Customer Acquisition Cost to Lifetime Value for each campaign. Impressions are basically worthless - focus on conversions and how long it takes people to buy. I'd start by auditing what you're currently measuring because I bet you're missing like half the data you need.
So many good options here! Google Data Studio or Tableau are solid for dashboards - honestly can't imagine running campaigns without real-time monitoring anymore. Heat maps show you exactly where people click on your site. Funnel charts? Perfect for catching those annoying drop-off points. I'm weirdly into cohort analysis lately - it's amazing for retention stuff. Line graphs work best for tracking trends over time, bar charts make channel performance super obvious. Oh, and please don't default to pie charts for literally everything. Pick whatever actually tells your story best.
-
Commendable slides with attractive designs. Extremely pleased with the fact that they are easy to modify. Great work!
-
The service is fast, and I could access any presentation after buying the subscription. I don’t think I’ll ever have to worry about a presentation in my life.