


Digital Marketing Report With Executive Summary




Try Before you Buy Download Free Sample Product
 Impress Your
 Audience
 100%
100% Editable
 Save Hours
 of Time


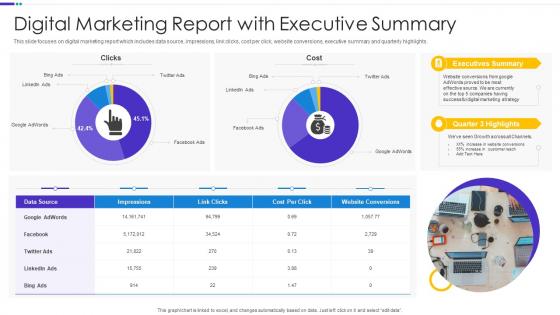
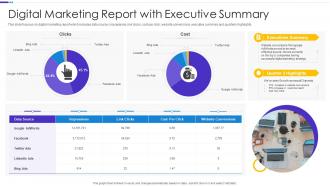
This slide focuses on digital marketing report which includes data source, impressions, link clicks, cost per click, website conversions, executive summary and quarterly highlights.
People who downloaded this PowerPoint presentation also viewed the following :
Digital Marketing Report With Executive Summary with all 7 slides:
Use our Digital Marketing Report With Executive Summary to effectively help you save your valuable time. They are readymade to fit into any presentation structure.





FAQs for Digital Marketing Report
Focus on metrics that actually drive your business forward - website traffic, conversion rates, cost per acquisition, and ROI are the heavy hitters. Time on page and bounce rate tell you if people care about your content. Social reach matters if you're active there, and email open rates are solid gold for campaigns. Here's the thing though - I've seen way too many reports crammed with like 20+ metrics nobody ever looks at twice. Pick maybe 6-8 that directly connect to revenue or leads. Compare month-to-month so you can actually spot what's working and what isn't.
Honestly, templates are a game-changer for making your data actually tell a story. They guide people through your info in a logical way - problem, then insight, then solution - instead of just throwing random charts at them. Plus you'll save yourself hours of work (I learned this the hard way after rebuilding the same layouts over and over). The trick is matching your template to who's reading it. Executives want those clean, high-level dashboards while your technical team needs all the nitty-gritty details. Just grab a good template library and tweak it to fit your brand colors and style.
KPIs are like your reality check for digital marketing - they tell you what's actually moving the needle vs. what just looks good on paper. Track stuff like conversion rates, click-through rates, customer acquisition costs. Honestly, without them you're just burning cash and crossing your fingers. Pick metrics that match your actual goals though, not just vanity numbers that sound impressive in meetings. I learned this the hard way lol. Set up a basic dashboard with your top 3-5 KPIs and check weekly. That way you can course-correct fast when campaigns start tanking.
So I'm totally guilty of stalking my competitors way too much, but honestly it works. Check what they're doing on social - their engagement rates, how much they're probably spending on ads, what content gets people talking. Keywords too, see where they're ranking that you're not. Compare their numbers to yours and you'll spot the gaps pretty quick. Maybe they're crushing it on TikTok while you're ignoring it, or they found some keyword goldmine you missed. Then just steal their best ideas (legally obviously) and tweak your strategy. Oh, and make sure you're actually looking at real competitors, not just random brands you think are cool.
SEO metrics are honestly the best way to see if your marketing's actually working. Better rankings = more qualified visitors who convert way better than paid traffic. That saves you serious cash. Your SEO data shows what content hits with people too, so you can use those same topics for social and email stuff. I mean, everything works better when you're visible in search. Track your organic click-through rates and keyword rankings each month - see how they match up with your conversion goals. It's pretty eye-opening once you start connecting the dots.
Check your top posts from last quarter - what do they have in common? That's your goldmine right there. Engagement shows what actually works, not what you think should work. Maybe your videos crush it while photos flop, or people go crazy for carousel posts. Honestly, timing matters way more than most people realize too. I'd look at when your best stuff posted and try to stick with those windows. Comments and shares tell you more than likes anyway - that's real engagement. Pull your top 10 performers and see what patterns jump out.
Honestly, most teams just stick with the basics - Google Analytics, HubSpot, SEMrush, Hootsuite. They work. If you want something fancier for visuals, Google Data Studio or Tableau are solid choices. Templates will save your life though, trust me on this one. Instead of rebuilding the same damn charts every month, you just drop in new data and you're set. Start simple with your main KPIs first. These platforms usually have templates already, or make your own once and keep reusing it. You can always add more complex stuff later when you actually need it.
Lead with the winner and the numbers - "Version B boosted click-through rates by 23%." Include sample size, test duration, and confidence level so people trust your data. Screenshots help too since everyone loves seeing the actual variations. Then dig into why it worked - maybe the headline was punchier or the button placement was better. Here's what I learned the hard way though: don't just announce a winner and walk away. Give them concrete next steps. Tell them exactly what to roll out and what you want to test next time.
Track what actually matters - conversion rates, customer acquisition costs, and how each channel performs. If TikTok suddenly starts bringing in solid leads, that's worth mentioning. Your executives will eat up competitive intel, so definitely include what competitors are doing differently. Algorithm changes that tanked your reach? Call those out too. Mobile vs desktop splits are still shifting like crazy, so keep an eye on that. Oh, and consumer behavior changes - people are weird and unpredictable, but patterns emerge. Wrap up each section with what you're testing next quarter based on the data you're seeing.
Your customer demographics are gonna totally change what you see in those marketing reports. Gen Z lives on TikTok while Boomers are still scrolling Facebook all day - completely different worlds, right? Conversion rates shift based on age and income. Content preferences too. Even peak engagement times vary by who's actually seeing your stuff. Oh, and different demographics prefer different channels for buying - that'll mess with your ROI numbers big time. When you're digging through report data, filter by demographic segments first. That's where you'll find the real patterns instead of just staring at useless averages.
Honestly, charts and graphs are a game changer for marketing reports. People's eyes just glaze over when you show them spreadsheets - I learned that the hard way. With visuals, stakeholders can instantly see trends and weird outliers without digging through rows of data. Executives especially eat this stuff up. You'll also catch patterns you'd totally miss in raw numbers. Bar charts and line graphs are perfect starting points, then you can get fancy with dashboards later. Makes your recommendations way more convincing too since everyone stays awake during presentations!
Honestly, open rates are like a report card for your subject lines and timing. Low opens? Your subject lines might be too pushy or boring - try adding some mystery or urgency instead. Also, when are you sending these? I used to blast emails at weird hours and wondered why nobody cared. High opens from certain groups are gold though - figure out what clicked with them and do more of that. Maybe it was your tone, the topic, who knows. Test one thing at a time so you'll actually know what's working. The data doesn't lie, but it takes some detective work to decode it properly.
Just be real about what your data's actually telling you - no cherry-picking the good stuff while hiding the messy parts. Context is huge too. Like, mention your attribution windows, sample sizes, any weird factors that might've thrown things off. I've seen so many reports that conveniently forget to mention the important caveats (drives me nuts honestly). Call out both your wins AND what didn't work. Your stakeholders aren't dumb - they need the full story to make decent decisions. Being transparent about test methods matters too. Bottom line: your credibility's on the line here.
So predictive analytics is pretty cool - it takes all your old marketing data and tries to figure out what'll happen next. Like instead of just seeing your email opens tanked, you can actually predict which customers might bail or when those weird seasonal dips are coming. Honestly took me a while to wrap my head around it, but now I can't imagine going back. You start catching problems before they happen rather than scrambling after. My advice? Pick one thing you really want to predict first and build from there.
Honestly, customer feedback is like striking gold for your marketing stuff. All those conversion numbers and survey responses? They're telling you which campaigns people actually cared about and which ones bombed hard. I always dig into the sentiment changes and look for those weird patterns you miss at first glance. Track how feedback shifts across different channels and time periods - sometimes the timing reveals everything. Use what you find to switch up your messaging or completely ditch campaigns that aren't working. Pain points in the customer journey show up pretty clearly if you're paying attention.
-
Excellent template with unique design.
-
A perfect platform for all your presentation needs. Unlimited products at an affordable price.