


Digital Marketing Project Weekly Status Report




Try Before you Buy Download Free Sample Product
 Impress Your
 Audience
 100%
100% Editable
 Save Hours
 of Time


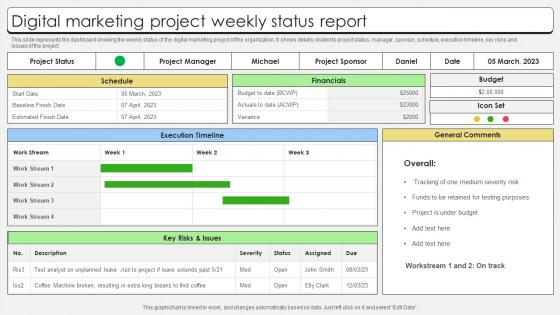
This slide represents the dashboard showing the weekly status of the digital marketing project of the organization. It shows details related to project status, manager, sponsor, schedule, execution timeline, key risks and issues of the project.
People who downloaded this PowerPoint presentation also viewed the following :
Digital Marketing Project Weekly Status Report with all 6 slides:
Use our Digital Marketing Project Weekly Status Report to effectively help you save your valuable time. They are readymade to fit into any presentation structure.





FAQs for Digital Marketing Project
Okay so for your digital marketing report, definitely hit the basics first - traffic stuff like sessions, users, bounce rate. ROI needs to be right up top because that's literally the first thing they'll ask about (learned that the hard way). Conversion data is huge too - leads, conversion rates, cost per acquisition. Don't skip engagement metrics like click-through rates and email opens. Budget tracking is non-negotiable. Oh, and here's what really helps - add a section for quick wins and current roadblocks. Makes you look proactive instead of just reporting numbers.
Dude, charts and graphs are seriously game-changers for campaign reports. People's brains just shut off when you show them raw spreadsheets - I swear it's like watching someone's soul leave their body. Dashboards with your CTR and ROAS make everything click instantly. Progress bars for milestones? Chef's kiss. Your stakeholders will actually pay attention instead of pretending they get it. Oh, and those before/after visuals work crazy well too. Makes trends super obvious. Way better than drowning everyone in numbers they'll forget five minutes later.
Honestly, the data mess is the worst part - stuff's spread across Analytics, Facebook, email platforms, everything. Getting consistent numbers when it's all in different places? Total nightmare. Everyone wants different metrics reported too, which gets annoying fast. Attribution's always gonna be fuzzy anyway (email vs retargeting ad, who knows?). Oh and time zones screw up your windows constantly. Here's what actually works: nail down your key metrics upfront, automate the data pulls you can, and don't stress about perfect attribution. Better to have decent insights quickly than waste weeks chasing perfect numbers.
Honestly, I'd go with weekly reports. Digital stuff changes so fast - your ad performance can tank overnight or budgets might blow through way quicker than expected. Weekly keeps everyone in the loop without you fielding a million "how's it going?" messages. Bi-weekly could work if it's a longer project, but then you're risking missing something important. I learned this the hard way when a campaign went sideways and nobody knew for two weeks. Start weekly, then maybe dial it back if things are super stable and predictable (spoiler: they won't be).
Think of stakeholders as your north star when writing reports. Who's actually reading this? Executives care about ROI, but your project manager just wants to know if timelines are screwed. Different audiences = different priorities, so you'll need to switch up your metrics and language for each group. Honestly, I always map out my readers first - saves me from rewriting the whole thing later. Then I make sure each section answers their "what's in it for me" question. It's basically telling the same story multiple ways, which sounds tedious but makes your report way more effective.
Honestly, automate everything you can - pull straight from Google Analytics, Facebook, whatever instead of typing numbers into spreadsheets. People mess that up constantly. Set your processes early and don't deviate from them, even when Karen from marketing swears her numbers are right. Cross-check different data sources regularly and make everyone double-check before submitting. Write down exactly how you're measuring stuff so the whole team's on the same page. Oh, and always build in extra time for checking everything before deadlines hit. Trust me on this one - rushed reports are disaster reports.
Honestly, charts are your best friend here - way better than throwing numbers at people. Show them follower growth and engagement over time visually. I'd start with maybe 2-3 big wins that actually connect to what the business cares about. Screenshots of your top posts work surprisingly well too, people love seeing the real content. Skip the vanity stuff like total followers (nobody really cares). Focus on engagement rates and click-throughs instead - that's where the money is. Oh, and always end with a "here's what we're trying next" section. Makes you look proactive.
Always tie your metrics back to the big business goals - that's what execs actually care about. Don't just say "CTR went up 15%." Explain how it pushes us closer to that Q4 revenue target. I learned this the hard way when my reports kept getting ignored lol. Your executive summary should call out exactly which business objectives you're hitting. Frame everything around business impact, not just campaign stats. Honestly, leadership doesn't give a damn about vanity metrics if they can't see how it affects their bottom line. Makes such a huge difference in how seriously they take your work.
Dude, just use Monday.com or Asana - they'll pull everything together automatically instead of you sitting there copying numbers around like it's 2015. Both connect to pretty much any marketing tool you're using (Google Analytics, social platforms, whatever). The visual dashboards look clean when you're presenting to clients too. Oh, and if your team's already on Slack, their reporting stuff is actually way better than you'd expect. I'd honestly just start with whatever project management thing you already have set up and add integrations from there. Way easier than starting from scratch.
Put budget variances right at the top - seriously, don't hide that stuff in footnotes. Break down what's over or under and why. Like maybe those Facebook ads killed it so you moved more money there, or that influencer thing was a total bust. Whatever happened, explain your reasoning and how you're fixing it. Oh, and always throw in your projected spend for the rest of the project. That way everyone knows if you're gonna hit your numbers or not.
So basically you're looking for patterns in your performance data - conversion rates, budget stuff, all that. Timeline slippages are honestly where most teams get screwed over again and again (learned this the hard way). Compare your last 3-4 reports to see what's consistently tanking vs. what's actually working. Resource allocation trends will jump out at you pretty quick. The real question is whether those strategic changes you made actually moved the needle or if you're just dealing with the same crap month after month. Makes for solid stakeholder presentations too.
Status reports are like having a crystal ball for your campaigns. I check mine weekly (not just when things go wrong lol) to spot which channels are picking up steam and which ones are tanking. You'll catch budget burn rates before they become disasters. Honestly, the historical data is gold for forecasting next quarter's performance. Seasonal trends become super obvious when you're actually looking at the numbers regularly. Plus you can adjust your resource planning on the fly instead of waiting until it's too late. Trust me, it's saved my butt more times than I can count.
Look, I've been down this road - nobody wants to read your novel-length updates. Put the important stuff first: wins, what's blocking you, what's next. Don't bore people with metrics that sound impressive but mean nothing. Same format every time so they know where to look. Honestly? I used to write these epic status emails that went straight to the trash. Now I template everything and save myself hours. Always include who's doing what and by when. Oh, and if something's about to go sideways, mention it early with your ideas for fixing it. People hate surprises way more than problems.
Don't wait until the end to ask for feedback - bake it right into your routine. After each report, do a quick 10-minute call instead of those endless email threads (trust me on this one). Ask what metrics they actually care about and which parts they're skipping over. Track the feedback patterns that keep popping up - that's literally your cheat sheet for next time. The whole point is making reports people will use for decisions. Oh, and make it conversational! You'll get way better insights when stakeholders feel like they can actually talk to you instead of just receiving your stuff.
Dude, layer your reports or you'll hate yourself later. Executive summary up top with the big wins and key numbers. Then stick all the nerdy details in appendices for people who actually want to dig in. I made the mistake of sending our CEO a 15-page deep dive once - learned that lesson fast. Charts work great for the high-level stuff, but separate out your raw data. Switch up your language too depending on who's reading. Tell execs "conversion jumped 23%" but your analytics team wants "p<0.05 significance." Oh, and always start with why it matters before explaining how you got there.
-
Nothing beats the well-formatted and professionally designed templates offered. Kudos to SlideTeam for their amazing collection of PPT slides.
-
Loved the fact that SlideTeam provides clean, high-definition, and professional PowerPoint products.