


Digital Marketing KPI Dashboard With Conversion And Bounce Rate


Try Before you Buy Download Free Sample Product
 Impress Your
 Audience
Editable
of Time


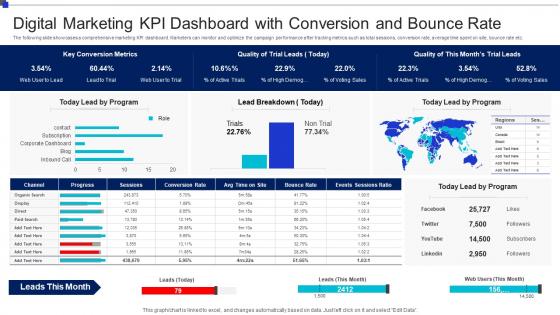
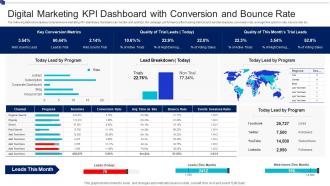
The following slide showcases a comprehensive marketing KPI dashboard. Marketers can monitor and optimize the campaign performance after tracking metrics such as total sessions, conversion rate, average time spent on site, bounce rate etc.
People who downloaded this PowerPoint presentation also viewed the following :
Digital Marketing KPI Dashboard With Conversion And Bounce Rate with all 7 slides:
Use our Digital Marketing KPI Dashboard With Conversion And Bounce Rate to effectively help you save your valuable time. They are readymade to fit into any presentation structure.


FAQs for Digital Marketing KPI Dashboard With Conversion
Essential digital marketing KPIs include conversion rates, customer acquisition cost, return on ad spend, website traffic sources, and email engagement metrics. These indicators enable marketers to optimize campaign performance, allocate resources strategically, and demonstrate ROI across channels, with many organizations finding that comprehensive dashboards streamline reporting while enhancing data-driven decision-making capabilities.
Businesses can tailor digital marketing KPI dashboards by selecting industry-specific metrics, customizing data visualization formats, integrating relevant analytics tools, and aligning tracking parameters with sector objectives. For example, e-commerce companies focus on conversion rates and cart abandonment, while SaaS platforms emphasize lead quality and customer acquisition costs, ultimately delivering actionable insights that enhance strategic decision-making and competitive positioning.
**INPUT**: What tools and software are best for creating and managing a digital marketing KPI dashboard? **OUTPUT**: Leading digital marketing KPI dashboard tools include Google Analytics, HubSpot, Tableau, Power BI, and Klipfolio, each offering real-time data visualization and automated reporting capabilities. These platforms streamline campaign performance tracking by integrating multiple data sources, enabling customizable metric displays, and delivering actionable insights, with many marketing teams finding that centralized dashboards enhance decision-making speed and ROI optimization.
Digital marketing KPIs should be updated and reported on weekly for tactical metrics like social media engagement and ad performance, monthly for strategic metrics like conversion rates and ROI, and quarterly for high-level business outcomes. This tiered approach enables marketing teams to make real-time optimizations while maintaining strategic oversight, with many organizations finding that automated dashboards streamline reporting cycles and enhance decision-making accuracy.
Leading indicators in digital marketing include website traffic, email open rates, social media engagement, content downloads, and lead generation metrics, while lagging indicators encompass conversion rates, customer acquisition costs, revenue attribution, and ROI. These should be represented through real-time widgets for leading metrics and trend analysis charts for lagging ones, with many organizations finding that this strategic combination enables proactive campaign optimization and clearer performance accountability.
Essential social media marketing metrics for KPI dashboards include engagement rates, reach and impressions, conversion rates, click-through rates, and follower growth trends. These metrics enable marketers to track audience interaction, content performance, and ROI across platforms like Facebook, Instagram, and LinkedIn, with many organizations finding that combining engagement data with conversion tracking delivers comprehensive insights into campaign effectiveness and strategic social media optimization.
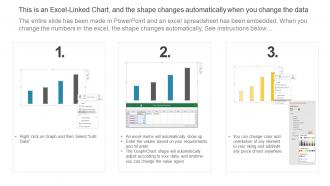
Visual data representation enhances digital marketing KPI dashboards by transforming complex metrics into intuitive charts, graphs, and heatmaps that enable faster pattern recognition, trend identification, and strategic decision-making. Through interactive visualizations, marketing teams can quickly spot campaign performance anomalies, audience engagement shifts, and conversion funnel bottlenecks, ultimately streamlining optimization processes and delivering more agile responses to market dynamics.
Customer feedback and engagement metrics serve as critical indicators of audience sentiment, brand perception, and content effectiveness within digital marketing dashboards, including social media interactions, review scores, and customer satisfaction ratings. These metrics enable marketing teams to optimize campaign messaging, identify emerging trends, and strengthen customer relationships, while providing actionable insights that drive higher conversion rates and long-term brand loyalty.
Businesses can integrate A/B testing results into their digital marketing KPI dashboards by tracking conversion rates, click-through rates, engagement metrics, and revenue attribution across test variations. These insights enable marketers to identify winning campaigns, optimize ad spend allocation, and make data-driven decisions in real-time, with many organizations finding that dashboard integration accelerates testing cycles and improves overall campaign performance.
Common mistakes include overloading dashboards with irrelevant metrics, failing to align KPIs with business objectives, using outdated data sources, and creating complex visualizations that confuse rather than clarify. Organizations should focus on actionable metrics, ensure real-time data integration, and design intuitive interfaces that enable marketing teams to make quick strategic decisions, ultimately delivering clearer campaign insights and improved ROI tracking.
Attribution modeling transforms digital marketing dashboard KPIs by redistributing credit across multiple touchpoints, providing more accurate customer journey insights than single-touch models. This strategic approach enables marketers to optimize budget allocation, identify high-performing channel combinations, and measure true campaign effectiveness, with many organizations finding significantly improved ROI through data-driven attribution insights.
SMART goals provide essential structure for KPI tracking by ensuring metrics align with specific business objectives, offer measurable outcomes, remain realistically achievable, and include clear timeframes for evaluation. This framework enables marketing teams to track meaningful progress, optimize campaigns effectively, and demonstrate ROI to stakeholders, ultimately delivering strategic focus and accountability across digital marketing initiatives.
Historical data trends in KPI dashboards reveal seasonal patterns, audience behaviors, and campaign performance cycles that enable marketers to predict optimal timing, budget allocation, and channel strategies. By analyzing conversion rates, engagement metrics, and customer acquisition costs over time, marketing teams can identify successful approaches, anticipate market shifts, and strategically adjust campaigns before competitors, ultimately delivering higher ROI and more targeted customer experiences.
Best practices for sharing digital marketing KPI dashboards include establishing automated reporting schedules, customizing access levels based on stakeholder roles, providing contextual commentary alongside metrics, and ensuring mobile accessibility for remote viewing. These approaches streamline communication by delivering relevant insights to executives, marketing teams, and department heads at optimal frequencies, while enabling real-time collaboration and data-driven decision making across organizations.
Automation enhances digital marketing KPI tracking by streamlining data collection, enabling real-time updates, and delivering automated alerts for performance thresholds. Through integrated analytics platforms, marketing teams can seamlessly consolidate metrics from multiple channels, reduce manual reporting errors, and access instant visualizations, ultimately enabling faster decision-making and strategic optimization.
-
Content of slide is easy to understand and edit.
-
Appreciate the research and its presentable format.