





 0 Comment
 Customer Reviews

Are you running your restaurant with real insight or just ‘instinctive’ understanding? With rising customer expectations and tight margins, managing a restaurant has become more data-driven than ever before. Whether you are overseeing a local bistro or a global chain, having access to real-time data through a restaurant performance dashboard can make or break your business. These dashboards are more than just attractive visuals as these provide insights into food service analytics, sales performance, inventory tracking as well as customer satisfaction.
Restaurants operate in dynamic, fast-paced environments that require quick and decisive decisions. A well-structured restaurant operations dashboard integrates various KPIs like order tracking, table turnover and food cost control which help managers to streamline workflows and make smarter decisions. It is a time-consuming process to build a dashboard from scratch and that’s where SlideTeam offers a smart solution.
SlideTeam's hospitality dashboard templates are made to make things clear. These templates take complicated data and turn it into useful information. For example, a cooking efficiency dashboard can help improve back-end performance and a customer feedback dashboard can help improve front-end insights. They are especially helpful for presenting reports to stakeholders who may not be familiar with technical jargon but need a clear picture of business health.
SlideTeam's PPT Templates cover everything from restaurant analytics panels to revenue tracking panels, enabling quick customizations and integrations.
Our ready-to-use inventory management dashboard templates—like those found in this inventory-focused blog—can drastically improve accuracy and speed in stock reporting, preventing wastage and optimizing procurement.
Whether you are a restaurateur looking to scale or a manager aiming to boost profitability, these dashboards help you to keep an eye on each activity of the business.
Let’s explore all the templates!!
Template 1: Restaurant Staff Training Analysis Dashboard
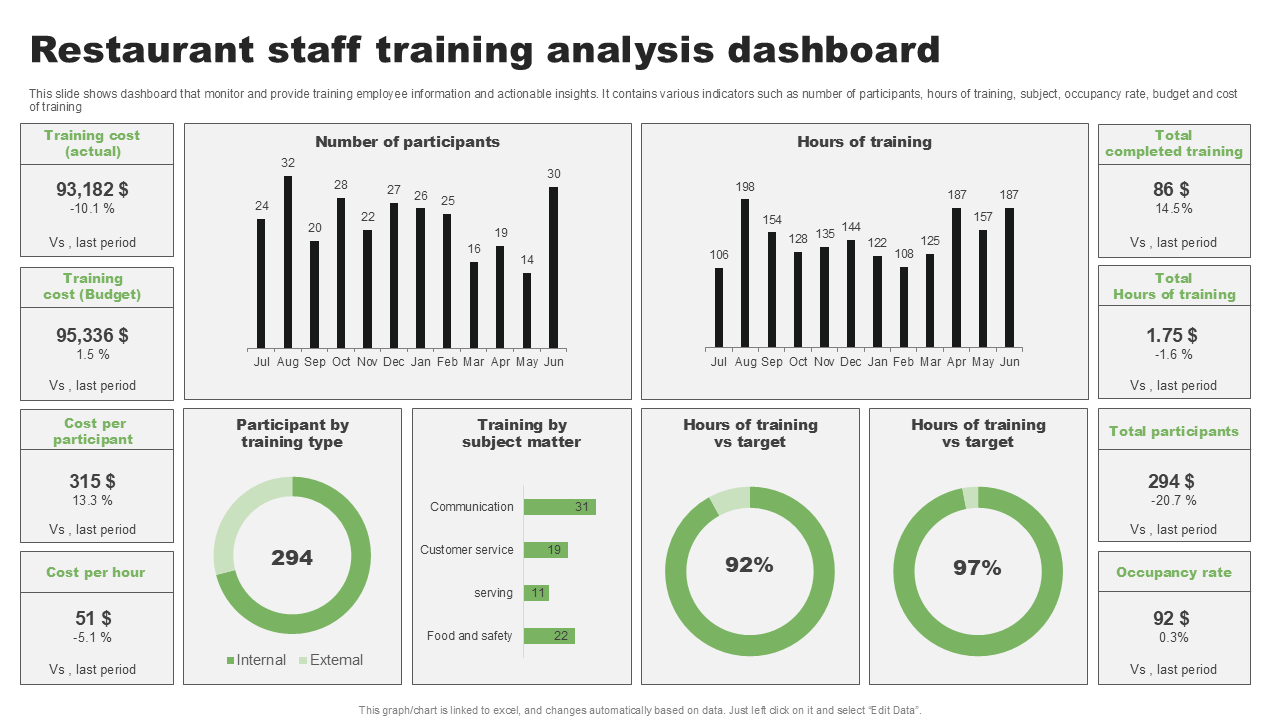
A detailed training analysis summary for restaurant workers is shown in this slide. It shows measures like real vs. budgeted training costs, the number of participants, hours of training, training types and subject matter focus. It shows success information like the cost per hour, the cost per member and the progress made towards training goals.
By keeping clear records of these training KPIs, businesses can show that they care about the growth of the employee in the business. This builds trust and confidence with customers who value consistent service quality and well-trained staff.
Template 2: Dashboard to Track Sales and Expenses of Restaurant
This slide shows a full picture of how well a restaurant is doing with sales, transactions, profits, and different types of costs. Key numbers are shown, including the total amount of sales, the total number of deals and the average value of a transaction. There are monthly patterns, daily average sales broken down by food and drinks and a pie chart of costs that are organised by type.
By showing specific operational and financial measures, this dashboard builds trust with clients by showing openness, fiscal responsibility and business choices based on data.

Template 3: Progressive Dashboard for restaurant operations management
This slide shows an interesting restaurant operations management dashboard with KPIs such as net sales, food and labour prices, staff performance and customer satisfaction. It looks at long-term trends and ranks sections based on how well they do their jobs. Scores on customer surveys, service speed and SPLH are some of the most important measures.
This kind of clear representation builds trust with customers by showing how efficiently the restaurant runs, how much it cares about quality and how it keeps track of performance all the time. It also reassures stakeholders that decisions are made based on data and with the customer in mind.

Template 4: Restaurants Operations Dashboard with Individual Costs
This slide shows how the prices of staff, alcohol and food vary between restaurant locations in cities like San Jose, New York and Miami. The costs are highest in San Jose across all categories. There are thorough bar graphs and a cluster chart that show the highest restaurant prices by district, with $192,006.47 in San Jose being the highest. Such cost transparency helps build client trust by demonstrating financial accountability, enabling stakeholders to see where resources are spent and how performance is going on across locations.

Template 5: Catering and Restaurant Marketing Analysis Dashboard
This slide analyzes catering and restaurant marketing performance using metrics like setup consistency, food presentation, equipment functionality and aesthetics. It includes ratings by auditor, location, time of day and meeting type. With a total of 9736 reviews and an average score of 54.09, the dashboard highlights top performance in setup utensils and lowest in conference room aesthetics. It builds client trust by offering data-driven insights, showing quality assurance, attention to detail and continuous improvement across service elements.

Template 6: Restaurant Management Dashboard with Inventory Summary
This slide provides a snapshot of restaurant operations, covering sales, purchases, inventory, product details and user data. It shows total sales, revenue, profit and inventory quantity. It also includes purchase metrics, low stock alerts and the number of customers and suppliers.
This dashboard builds client trust by offering transparent, data-driven insights into financials and resource allocation, demonstrating control, efficiency and a commitment to accountability and streamlined operations.

Template 7: Restaurant Marketing Analysis Dashboard for Hospitality Company
Emphasising income, cost, net income and food and beverage revenue by location and kind, this presentation offers a whole picture of restaurant marketing success. It also contrasts actual vs. projected income numbers among many corporate divisions and breaks down expenses by account and department.
This dashboard builds client trust by showcasing financial transparency, operational efficiency, and data-driven decision-making, assuring stakeholders that business resources are being strategically managed and monitored for profitability.

Template 8: KPI Dashboard Showcasing Restaurant Inventory Status
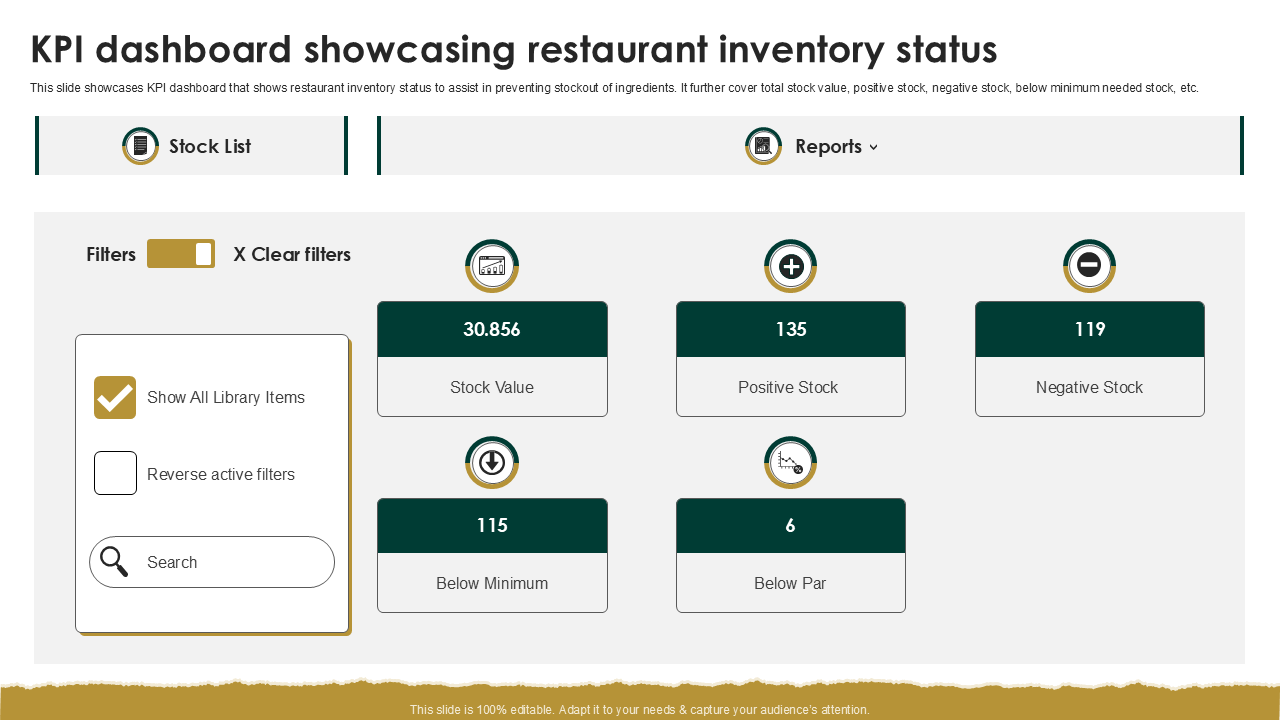
This slide provides a snapshot of restaurant inventory KPIs, showing stock value, positive stock, negative stock and critical figures like items below minimum and below par. Search terms and filters allow for improved data analysis, which helps with inventory control.
By showing proactive inventory control, therefore reducing stockouts and guaranteeing resource availability, this dashboard promotes customer confidence. It shows operational discipline and preparedness, thus reassuring customers that inventory is effectively tracked and complies with service quality criteria.
Template 9: Point of Sales Dashboard For Restaurant Business
Showing total income from orders across dining-in, delivery and takeout services, this slide offers a point of sales overview. It emphasises average basket size, channel-by-channel income split, and lost business brought on by postponed or rejected orders. A graphic trend documents income declines throughout time. By providing openness into sales performance, pointing up inefficiencies and highlighting data-driven decision-making, this dashboard fosters client trust. It demonstrates how to maximize corporate results and streamline service delivery.

Template 10: Food Delivery Restaurant Performance Tracking Dashboard
For a meal delivery business, this dashboard shows KPIs including total orders, completed orders, in-progress, cancelled, average order cost, tickets, waitlist, customer feedback, inventory, revenue, repeat customer rate and safety stock.
It highlights trends and developments by means of real-time information offered via images and percentages. The dashboard fosters client confidence by providing open and current performance statistics, consequently proving effective operations and a dedication to quality service and customer happiness by means of accountability.

Template 11: KPI Dashboard For Modernizing Restaurant Business
This presentation shows a complete KPI dashboard with fiscal year revenues, category-wise costs, average transaction total and overall transactions. It covers daily average sales by weekdays, labour margins, and non-labour costs Staff management, supplier ordering and customer service are among the areas that this real-time, data-driven review helps simplify.
By displaying efficiency, responsibility and a clear emphasis on operational excellence, such openness helps clients trust.

Drive Restaurant Success with Data-Backed Dashboards
Successful restaurants are dependent on fast judgements based on knowledge. Our restaurant dashboard templates enable you to turn unprocessed data into smart company plans. These dashboards enable quick responses to operational difficulties by tracking POS transactions, food cost change and table turnover efficiency.
Using SlideTeam's well-crafted templates keeps you ahead of trends, predict problems and provide first-rate service. Supported by data and motivated by performance, their dashboards help your restaurant on its path towards greatness.
PS: Take control of your finances with SlideTeam’s Top 10 Expense Dashboard Templates – a simple way to track spending and save smarter!
FAQs on Restaurant Dashboard
1) What are the key metrics displayed on a restaurant dashboard?
Metrics like daily sales, order volume, inventory turnover, food cost percentage and employee efficiency are all part of a complete restaurant performance report. Average table turnover time, customer feedback scores and point-of-sale activity are some other useful KPIs. These help keep an eye on different parts of both the front and back of the house.
2) How does the dashboard help monitor daily operations?
Dashboards put all of your important data, like sales, orders, hiring and supplies, in one place where you can see and change it. A powerful restaurant operations screen shows real-time information about tracking orders, cooking efficiency and table availability, which helps you deal with daily problems more quickly.
This makes the service better, cuts down on waste and makes sure that everything runs more smoothly in your restaurant.
3) What KPIs are most important for restaurant performance?
Some of the most important KPIs for a restaurant's success are the average order value, the labour cost ratio, the income per table, and the customer happiness score. These measures make it easy to see how profitable, efficient and enjoyable the guests are.
A well-organized restaurant KPI tracker lets you compare performance, spot trends and make choices based on facts that will help your business grow.


