

Digital Marketing KPI Dashboard Snapshot With Engagement Rate




Try Before you Buy Download Free Sample Product
 Impress Your
 Audience
 100%
100% Editable
 Save Hours
 of Time


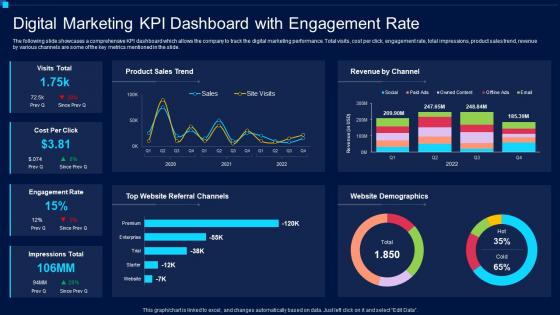
The following slide showcases a comprehensive KPI dashboard which allows the company to track the digital marketing performance. Total visits, cost per click, engagement rate, total impressions, product sales trend, revenue by various channels are some of the key metrics mentioned in the slide.
People who downloaded this PowerPoint presentation also viewed the following :
Digital Marketing KPI Dashboard Snapshot With Engagement Rate with all 7 slides:
Use our Digital Marketing KPI Dashboard Snapshot With Engagement Rate to effectively help you save your valuable time. They are readymade to fit into any presentation structure.





FAQs for Digital Marketing KPI Dashboard Snapshot
Okay so definitely focus on the big four first: traffic numbers, how engaged people actually are, conversions, and your ROI stuff. Those vanity metrics everyone obsesses over? Total waste of time honestly. I'd stick to maybe 8-10 KPIs tops when you're starting out - any more and you'll get overwhelmed trying to track everything. Email open rates matter if that's your thing, same with social engagement. But here's what I learned the hard way: every single metric needs to connect to something you can actually do something about. Otherwise you're just watching numbers go up and down for no reason.
Honestly, having everything in one dashboard is a game changer. No more tab-hopping between Google Analytics and Facebook Ads just to figure out what's happening – that gets old fast. You can actually see which channels are converting and where you're burning money for no reason. Plus you know right away if you're on track for monthly goals or totally screwing up. The trick is focusing on metrics that actually matter to your business, not just the flashy numbers that make you feel good. I made that mistake early on and wasted so much time on useless data.
Honestly, just start with Google Data Studio - it's free and connects to all the Google stuff you're probably already using. If you need fancier visuals later, Tableau and Power BI are solid but they're kinda pricey. HubSpot has decent dashboards built in if you're using them anyway. I actually know someone who just uses Google Sheets with some formulas and it works fine for basic tracking. Power BI's interface is way better than it used to be though. Don't overthink it - try Data Studio first since it won't cost you anything.
Honestly, daily updates work for most KPIs. But it totally depends on what you're measuring. Website traffic or ad spend? Yeah, check those hourly if you want. SEO rankings though - weekly is fine, maybe even monthly for some stuff. I used to check social followers like every hour and it drove me crazy lol. Match your refresh rate to how quickly you actually make decisions. Campaign optimization happens daily? Then pull daily data. Just set up auto-refresh so you're not doing it manually every morning like some kind of masochist.
Honestly, your brain just absorbs visual stuff way faster than spreadsheet hell. Charts and graphs? You'll spot problems in seconds instead of hunting through endless rows of data. Color-coded dashboards are a game changer - green means good, red means fix it NOW. Makes sharing results with teammates so much easier too, especially the ones who glaze over at numbers. I actually look forward to checking my performance now instead of dreading it. Just grab a dashboard tool and set up clear visual indicators. Trust me, you'll wonder how you survived without it.
Start by figuring out what you're actually trying to achieve business-wise, then pick metrics that match those goals. Lead gen focused? Go with conversion rates and cost per lead instead of meaningless stuff like total impressions. Brand awareness is more about reach and engagement. Most tools let you drag widgets around and set alerts when numbers hit certain points. Honestly, I've seen so many dashboards that are just complete messes because they tried to cram everything in. Keep it clean—maybe 5-7 metrics that actually matter. Oh, and you can usually filter by date ranges too, which helps a ton.
Honestly, most people just cram way too much stuff on one screen - it becomes this overwhelming mess. Don't chase vanity metrics either, like total followers when you actually need conversion data. Make sure your KPIs connect to real business goals, not just random numbers that look cool. Inconsistent timeframes will confuse the hell out of everyone too. Keep it simple - maybe 5-7 key metrics max. And seriously, nobody wants to squint at tiny charts during meetings! Always ask yourself: "what would I actually DO with this info?" That's usually the test of whether it belongs on there.
Here's how I track ROI - just use this basic formula: (Revenue - Campaign Cost) / Campaign Cost × 100. Connect your ad spend to conversion data in whatever dashboard you're using. Honestly, the hardest part is tracking the whole customer journey instead of just last-click stuff, which totally misses how people actually buy. I set up separate ROI widgets for each channel so I can see what's killing it and what's... not. Makes it way easier to move money around quickly when something's clearly working better.
Dude, conversion rates are like the only metric that actually matters - they show if people are doing what you want them to do. Track the stuff that counts: email signups, purchases, whatever your main goal is. All those other numbers are pretty much useless if nobody's converting. You can break it down by where traffic's coming from too, which gets interesting when you see which campaigns are duds. Oh and definitely pick your most important action first - don't try tracking everything at once or you'll go crazy. That's where I'd start anyway.
Most dashboard tools like Google Data Studio or HubSpot have connectors that'll automatically pull your social media data from Facebook, Instagram, Twitter, LinkedIn - all that stuff. APIs work too if you need something custom. Here's the thing though - skip the vanity metrics like follower counts. Focus on what actually makes you money: click-through rates, leads, sales attributed to social. I learned this the hard way after obsessing over likes for months lol. Set up automated reports so everything refreshes daily. Trust me, you don't want to be stuck updating spreadsheets manually forever.
Think of website traffic like counting how many people walk into your store. You'll see which marketing actually works and which stuff is just burning money. Honestly, most people obsess over vanity metrics, but traffic patterns show you way more - like where users get stuck or bail out completely. When your site breaks, traffic usually tanks first so you catch problems early. Page views and unique visitors are good starting points. Oh, and don't forget tracking where people come from - social, Google, whatever. That data helps you double down on what's working.
So for A/B testing dashboards, I'd go with side-by-side cards showing your conversion rates, CTR, all that good stuff. Color coding works wonders - green for winners, red for losers. Those little winner badges are honestly my favorite part, makes everything so clear instantly. Don't forget confidence levels and sample sizes though, otherwise stakeholders will ask if the results actually mean anything. Oh, and set up alerts when tests hit significance - saves you from manually checking constantly. The whole point is making it visual enough that anyone can spot the winning variant in like 2 seconds.
Honestly, tracking engagement is a game changer - you'll actually see what content hits and what bombs. Like when you get crazy high impressions but nobody clicks? Your messaging probably sucks. I always check which posts perform best and when people are actually online (sounds obvious but you'd be surprised). The real win is catching drops before they wreck your conversions. Set up alerts so you're not scrambling later wondering why everything tanked. Plus you can tell which platforms bring quality users vs just random eyeballs scrolling past your stuff.
Look, just pick the KPIs that actually match what you're trying to do. Brand awareness? Track reach and impressions. Want conversions? Focus on conversion rate and cost per acquisition. Don't fall into that trap of measuring everything just because you can - honestly, it's such a waste of time. Figure out your top 3 business goals first, then find the metrics that actually matter for each one. Oh, and make different dashboards for different people. Your CMO doesn't need the same granular stuff your paid media person does. Cut anything that won't help you make real decisions.
Honestly, showing your KPI dashboard to other teams is a game-changer. Sales suddenly gets why you're obsessing over lead quality scores. Customer service finally understands those acquisition costs they keep hearing about. You'll stop getting random "hey can you whip up a quick campaign" requests too – people actually see what's on your plate. The sales team especially eats up conversion funnel data because it helps them prioritize better prospects. I'd start with monthly snapshots for key people. They don't need to see every metric update in real-time (that's honestly overwhelming anyway), just enough context to stay aligned.
-
The content is very helpful from business point of view.
-
Unique and attractive product design.