


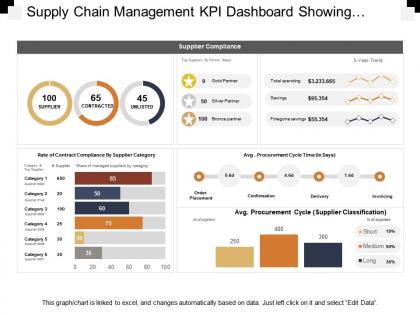
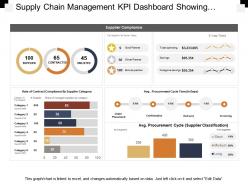
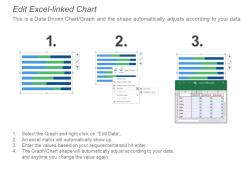
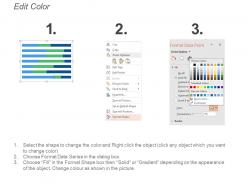
Supply chain management kpi dashboard showing supplier compliance stats





Try Before you Buy Download Free Sample Product
 Impress Your
 Audience
 100%
100% Editable
 Save Hours
 of Time


Enlarge your customer base with our Supply Chain Management Kpi Dashboard Showing Supplier Compliance Stats. Ensure their demands increase exponentially
People who downloaded this PowerPoint presentation also viewed the following :
Supply chain management kpi dashboard showing supplier compliance stats with all 6 slides:
Build fresh hope of a brighter future with our Supply Chain Management Kpi Dashboard Showing Supplier Compliance Stats. Be able to address the demoralised.
FAQs for Supply chain management kpi dashboard showing
Honestly, less is more with supply chain dashboards. Track your inventory turnover and stockouts first - that's where you'll catch problems early. Delivery stuff like on-time rates and order accuracy matter too, obviously. Cost per unit for transportation and your total supply chain spend as percentage of revenue are non-negotiables. Oh, and don't skip quality metrics - defect rates and how your suppliers are actually performing. Here's the thing though: I've seen people try to track like 30 different things and it becomes useless noise. Stick to maybe 10 KPIs tops, ones that actually move the needle for your business. Real-time updates are clutch so you can jump on issues fast.
Dude, real-time data integration is seriously a game changer for supply chain dashboards. You'll catch problems and opportunities right as they happen instead of staring at yesterday's mess wondering what went sideways. Live updates on inventory, shipments, supplier hiccups, demand changes - all of it. When your supplier screws up or demand goes crazy in Texas (or wherever), you can actually react fast. Though honestly the setup can be a pain at first. The trick is getting your ERP, warehouse systems, and transport stuff all talking to each other so everything updates automatically. No more manual data entry hell.
Start with visual hierarchy - put your critical KPIs like on-time delivery front and center. Color coding helps tons (red for problems, green for good stuff), but don't cram everything on one screen. Seriously, some dashboards look absolutely bonkers with info everywhere. Group related stuff together - supplier data in one spot, logistics in another. Your stakeholders need to drill down from big picture trends into specifics when something's off. Oh, and inventory turns should be super visible too since that's usually what everyone's actually worried about.
So it really depends on what industry you're in, honestly. Retail folks are super focused on inventory turnover and avoiding stockouts - makes total sense since angry customers are the worst. Manufacturing is all about keeping machines running and hitting production targets. Every minute of downtime = money down the drain. Healthcare has to obsess over expiry dates and compliance stuff because, you know, lives are literally on the line. Food companies are constantly watching their cold chain temps. Don't just track metrics because you can though - pick the ones that actually move the needle for your specific business.
So predictive analytics flips your supply chain reporting from "here's what already happened" to actually seeing what's coming. You'll spot demand spikes and supplier issues weeks before they screw you over. Way better than just staring at last month's stockout numbers, right? Your dashboards start showing stuff like "expect inventory problems in these categories next quarter" instead of "oops, we ran out again." I'd honestly pick one area where you've got decent historical data first - don't try to boil the ocean. Once it clicks, you'll wonder how you managed without it.
First thing - figure out what your business actually cares about. Customer happiness? Track delivery times and order accuracy, not just costs. Pick maybe 5-7 KPIs that leadership will actually look at (honestly, I've seen so many useless dashboards that track random stuff nobody uses). Each metric needs an owner and clear targets. You can always add more detailed operational stuff underneath for when people want to dig deeper. Oh, and definitely test it with real users first - saves you from building something nobody wants to touch.
Honestly? Power BI and Tableau are your go-to options here - both handle supply chain data really well. If you're already using Microsoft stuff, Power BI's gonna play nice with everything. Excel works too, though it gets messy once you have tons of data flowing through. QlikView's decent if you want something more specialized. My buddy at work swears by their ERP-integrated dashboard, but that might be overkill depending on your setup. Start with whatever your team already knows how to use - way easier than forcing everyone to learn something completely new from scratch.
Get your data sources locked down first - automate feeds from ERP, WMS, and TMS instead of doing manual uploads. Bad data will absolutely wreck your dashboard, trust me on this one. Build in validation rules that catch outliers and missing stuff, plus audit trails so you know where problems start. Oh, and assign data owners for each KPI who'll actually be held responsible for keeping things accurate. I'd start with maybe 3-5 key metrics, nail those down completely, then add more. Regular quality checks need to be baked into the whole process from day one.
Honestly, just focus on the big stuff - on-time delivery, quality issues (like defect rates), and whether they're sticking to contracted prices. Responsiveness matters too. Are they quick to fix problems or total ghosts when stuff goes sideways? For critical suppliers, I'd definitely check their financial health - learned that one the hard way. Lead times are huge for planning. Pick maybe 5-6 metrics that actually matter to your business instead of drowning in data. Set up alerts so you catch issues early rather than scrambling when everything's already on fire.
Dude, those supply chain dashboards are honestly game-changers for spotting bottlenecks. Track stuff like how fast you're processing orders, inventory turnover, delivery times - the usual suspects. When lead times suddenly spike or your on-time delivery tanks? That's your red flag moment. You can dig into specific warehouses or suppliers to see exactly where things are jamming up. I'd definitely set alerts for your most important metrics first - catching problems early beats scrambling later. Oh, and focus on the routes that move your biggest volume. Those hurt the most when they break down.
Look, the whole trick is customizing it for different people - executives want the big picture stuff while ops teams need details they can actually do something with. Make it interactive too, so people can dig into whatever they care about. Honestly, most dashboards I've seen just sit there looking fancy but nobody uses them. Train people on what the numbers actually mean - that's huge. Also set up regular check-ins where they can complain about what's not working lol. The goal is making them feel like it's their dashboard, not some generic report that gets ignored every week.
Honestly? Monthly if you can manage it, but quarterly at the bare minimum. Supply chains are crazy fast-moving - one week you're worried about lead times, next week it's all about cost reduction because budgets got slashed. I've watched teams waste months tracking stuff that stopped mattering ages ago. Like, why are we still measuring this metric from 2022? Set up a regular meeting with your team to actually look at what's working. Some KPIs might need small tweaks. Others you'll want to scrap completely. The goal is making sure you're tracking things that actually drive the behaviors you want right now.
Oh man, data quality is gonna be your biggest headache - trust me on this one. Your info is scattered everywhere and nothing connects properly, so you'll spend forever just cleaning stuff up. Getting departments on board? Good luck with that. Half of them think you're trying to spy on their work. Everyone's got different ideas about which metrics actually matter too, which gets messy fast. Honestly though, just pick like 3-5 key numbers and run a small test first. Get some wins under your belt, then people will actually listen when you want to expand.
Dude, visualization tools are game-changers for supply chain stuff. Your brain just gets visual info way faster than staring at endless spreadsheet rows. Heat maps and dashboards let you spot problems before they explode - we literally almost ran out of key components once because nobody caught our supplier's deliveries slowly tanking. Real-time inventory levels, delivery tracking, supplier risks... when it's all visual, patterns jump out immediately. Honestly, the time savings alone make it worth it. Start with whatever metrics stress you out most and build from there.
Don't cram everything onto one screen - honestly, it just turns into useless noise. People love tracking vanity metrics that look fancy but won't actually help you make decisions. Make sure your KPIs actually match what matters to your business, otherwise you're optimizing for the wrong stuff. Bad charts are another killer - if you can't spot trends quickly, what's the point? I'd stick with maybe 5-7 metrics that really impact your supply chain. Keep your data fresh enough to be useful, and always ask yourself "so what?" before adding anything new.
-
Unique research projects to present in meeting.
-
Topic best represented with attractive design.