


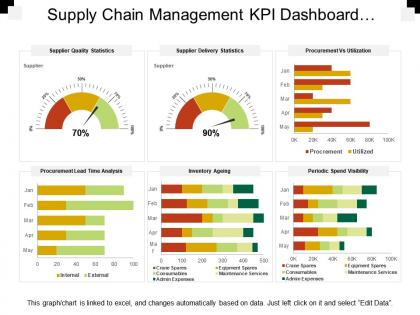
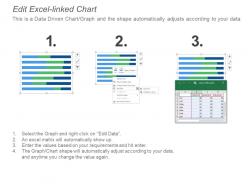
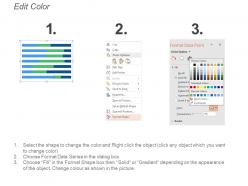
Supply chain management kpi dashboard showing procurement vs utilization




Try Before you Buy Download Free Sample Product
 Impress Your
 Audience
 100%
100% Editable
 Save Hours
 of Time


Awaken innate ability with our Supply Chain Management Kpi Dashboard Showing Procurement Vs Utilization. Give dormant characteristics a chance to emerge.
People who downloaded this PowerPoint presentation also viewed the following :
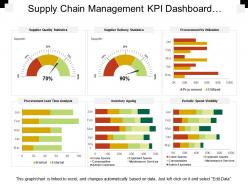
Supply chain management kpi dashboard showing procurement vs utilization with all 6 slides:
Focus decades ahead with our Supply Chain Management Kpi Dashboard Showing Procurement Vs Utilization. They help develop great foresight.
FAQs for Supply chain management kpi dashboard showing
Focus on order fulfillment rate, inventory turnover, and on-time delivery first - those three give you the clearest picture of how things are actually running. Days sales outstanding matters too since it hits your cash flow directly. Oh, and supplier lead times because nobody likes surprises there. Perfect order rate catches quality stuff early which saves headaches later. Seriously though, don't go crazy tracking everything under the sun or you'll spend more time in spreadsheets than actually fixing problems. These five will tell you what you need to know. You can always add more later if something specific keeps breaking.
Honestly, just pick 3-4 metrics that actually matter to your business - like delivery times, quality rates, stuff like that. Then build simple scorecards and share the data with your suppliers regularly. Most of them don't hate this as much as you'd think! They'd rather know exactly what you want than play guessing games. Work together on improvement targets and maybe tie performance to contract renewals or preferred status. Oh, and don't make it feel like you're punishing them - that never works. The whole point is transparency and getting everyone on the same page about expectations.
Lead times are huge for customer satisfaction and keeping inventory costs down. Track them consistently and you'll catch bottlenecks before they screw you over. One company I know about cut working capital by 20% just from better lead time visibility - crazy how much cash sits around doing nothing. You want to measure planned vs actual times, then break it down by supplier or shipping route. Weekly averages work well. Honestly, most people don't realize where their biggest problems are until they start tracking this stuff properly. It's like suddenly having x-ray vision for your supply chain.
So you take orders that went perfectly - on time, right quantities, no damage, correct paperwork - and divide by total orders. Times 100 for percentage. Sounds easy but it's actually pretty telling about your whole supply chain. I mean, customers definitely notice when stuff goes wrong. Most places shoot for 95%+ though honestly that's tough depending on how complex your operation is. Even hitting 90% can be a pain sometimes. Check it monthly and when it drops, figure out where things are breaking down. It hits customer satisfaction hard so it's worth tracking.
Think of inventory turnover as your business's metabolism - fast enough to stay healthy, but not so crazy you burn out. You're basically measuring how quickly stuff moves off your shelves into actual sales. Low turnover? That's cash just sitting there doing nothing, which honestly drives me nuts. Usually means you're overstocked or your forecasting is off. Super high turnover sounds great, but you might end up disappointing customers when you're constantly sold out. Check it monthly and see how you stack up against competitors. Catching problems early beats scrambling later.
Honestly, start with the basics - on-time delivery, order accuracy, and lead times. Those are what customers actually care about. Perfect order rate is huge because it rolls everything together into one number. Fill rates matter too since nobody wants to hear "oops, we're sold out" after ordering something. Track return rates and how fast you handle complaints. Oh, and backorder levels - that's a big one I almost forgot. Pick maybe 2-3 metrics that match whatever's bugging your customers most right now. Don't try to measure everything at once or you'll go crazy.
Honestly, visualizing your supply chain data is a game changer. Instead of staring at endless spreadsheets, you can actually see what's happening. Real-time dashboards show everything from supplier performance to inventory levels in one place. Heat maps are seriously addictive - they make problem spots jump out immediately. You can click through interactive charts to dig deeper when something looks off. My advice? Pick your top 3-5 KPIs first and just start there. You'll be amazed at the patterns that suddenly become obvious. Way better than drowning in Excel hell.
Honestly, the hardest part is finding benchmark data that's actually relevant to what you're doing. Generic industry numbers are pretty useless when your product mix and location are totally different. Benchmarks also go stale super quick - I mean, anything from 2019 is basically ancient history now with how crazy supply chains got. You'll need to pick between comparing against your own past performance versus competitors. Start with your internal stuff first since you've already got that data sitting around. Way easier than hunting down reliable external benchmarks, which is honestly a pain.
Here's what I've seen work really well - connecting your ERP, warehouse systems, and sensors cuts out all those manual entry mistakes that mess up your KPIs. Real-time data flows between everything automatically, so you're not stuck with Sarah's spreadsheet from two weeks ago (we've all been there). The best part? Built-in validation catches weird numbers before they make it into your reports. Your data gets cleaner, reporting happens faster, and you won't look stupid in front of the executives. Honestly, just start with whatever data gap is driving you most crazy and connect those systems first.
Honestly, bad demand forecasting just wrecks everything downstream. Your inventory turnover tanks because you're either drowning in stock or constantly sold out. Overforecasting? Your carrying costs go through the roof. Underforecasting is probably worse though - nothing pisses off customers like empty shelves. Cash flow gets weird since you've got money tied up in all the wrong stuff. Even your suppliers start giving you side-eye when your orders are all over the place. I'd start tracking your forecast accuracy each month and figure out which products or seasons always trip you up. Warehouse efficiency suffers too, but that's a whole other mess.
Look, operational and financial KPIs are totally connected - when one gets better, the other usually follows. Better inventory turnover cuts your carrying costs. Faster cycles mean less labor expense. Higher fill rates = more revenue, obviously. It's this whole chain reaction thing. Optimize delivery or cut waste? You'll see it hit your cost per unit and margins pretty quickly. Though honestly, I've seen people get obsessed with operational metrics that don't actually help the bottom line - that's why you gotta track both. Figure out which operational wins actually make you money first.
Honestly, just focus on the KPIs that actually matter to your big picture goals. Like if customer satisfaction is your thing, track on-time delivery instead of some random internal metric that makes you feel productive but doesn't help anyone. Get leadership to agree on what "winning" looks like first - saves so much headache later. I'd review these quarterly since priorities change constantly. Oh, and here's the test: ask yourself if hitting this number would genuinely move your business forward. If not, ditch it. Too many companies get obsessed with metrics that look impressive in meetings but are basically useless.
So first thing - figure out what actually matters in your industry. Pharma companies obsess over regulatory stuff while retail cares more about speed. Check what competitors track and grab some benchmarks from trade groups if you can. Your business model makes a huge difference too. B2B vs B2C is like night and day honestly. Don't just copy random supply chain metrics everyone talks about - pick 3-5 that'll actually move the needle for your bottom line and customers. Start there and you can always add more later if needed.
Honestly, you can't skip sustainability metrics anymore if you want to stay relevant. Carbon footprint, waste reduction, ethical sourcing - these need to sit right next to your usual cost and speed numbers. Your customers expect it, investors are asking for it, and don't get me started on EU regulations (they're brutal about this stuff). Just integrate them into whatever dashboards you're already using instead of creating some separate thing. Pick maybe two sustainability KPIs that actually make sense for your business first. You can always add more later once you've got the hang of it.
Honestly? Monthly reviews work best for the critical stuff. I've seen too many companies that do quarterly check-ins and miss important shifts. Fast-moving industries like tech or consumer goods definitely need that monthly cadence - things change way too quickly otherwise. Stable industries can probably stretch it to quarterly, but here's the thing: don't just stare at the numbers. Actually adjust your targets when needed. Add new KPIs if your strategy changes. Oh, and set up that recurring calendar invite right now or you'll forget. Trust me on this one - it never happens otherwise.
-
Illustrative design with editable content. Exceptional value for money. Highly pleased with the product.
-
Awesomely designed templates, Easy to understand.