


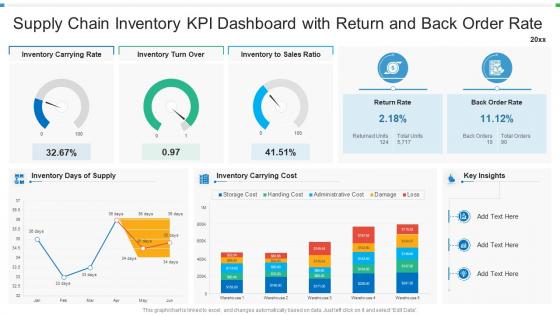
Supply chain inventory kpi dashboard with return and back order rate




Try Before you Buy Download Free Sample Product
 Impress Your
 Audience
 100%
100% Editable
 Save Hours
 of Time


Our Supply Chain Inventory KPI Dashboard With Return And Back Order Rate are topically designed to provide an attractive backdrop to any subject. Use them to look like a presentation pro.
People who downloaded this PowerPoint presentation also viewed the following :
Supply chain inventory kpi dashboard with return and back order rate with all 2 slides:
Use our Supply Chain Inventory KPI Dashboard With Return And Back Order Rate to effectively help you save your valuable time. They are readymade to fit into any presentation structure.
FAQs for Supply chain inventory kpi dashboard with return and
Honestly, start with the basics: inventory turnover, fill rate, order cycle time, and cost per shipment. Those are your bread and butter. Supplier performance metrics are clutch too - learned that one the hard way. Mix in some warehouse throughput numbers with customer stuff like on-time delivery. Demand forecast accuracy is another must-have, though forecasting is basically educated guessing half the time anyway. Don't pile on too many metrics right away or you'll drown in data. Pick maybe 6-8 that actually matter to your business, then expand once everyone's used to checking the dashboard regularly.
Honestly, good visuals are what separate useful KPI dashboards from total chaos. Red/yellow/green color coding is your best friend - everyone instantly knows what's up. I've wasted way too many hours squinting at spreadsheets when a simple line chart would've shown the trend immediately. Heat maps work great for comparing performance across regions or suppliers. The trick is matching your visual to the story you're telling. Bar charts for comparisons, line charts for trends over time. Pick your top 5 KPIs first and nail those visually before getting fancy with anything else.
Honestly, data silos are gonna be your biggest headache - getting clean info from all your systems is such a mess at first. Teams hate changing how they work, trust me on that one. You'll waste so much time figuring out which metrics actually matter vs what just looks pretty on a dashboard. Integration costs? They get crazy expensive fast, especially with old systems that basically hate each other. Oh, and don't try building some perfect setup right away. Pick like 3-5 key metrics, nail those first, then slowly add more. Way less painful that way.
Monthly reviews are the bare minimum, but weekly's way better if you can swing it. Delivery times and inventory levels change fast - wait too long and small issues snowball into disasters. Strategic stuff like supplier diversity? That can wait for quarterly check-ins. Honestly, set up automated alerts for your critical numbers so you're not flying blind between reviews. Start monthly and see how crazy your data gets, then adjust from there. Oh, and actually put these reviews in your calendar right now or you'll 100% forget about them.
Yeah, real-time data is huge for KPIs - you don't want to be making calls on stuff that's already old news. Live feeds let you catch problems like inventory issues or shipping delays right when they happen instead of finding out the next day. Trust me, explaining why you missed a stockout is never fun! Just make sure your data integration isn't garbage though - fast but wrong data is pretty useless. Oh, and set up those automated alerts so you can actually do something about problems when they pop up.
Honestly, start with what your company actually cares about - growth, profits, keeping customers happy, whatever. Then pick supply chain metrics that directly tie to those goals. Revenue growth your main thing? Focus on order fulfillment rates and how fast inventory moves. Don't fall into the trap of tracking every little thing (I swear some dashboards are just metric soup). Each KPI should answer "does this help us win or not?" Get leadership to pick maybe 5-7 that actually matter. Less is more here.
Power BI and Tableau are your go-to options - both handle supply chain data really well. Already using Microsoft stuff? Power BI will play nice with everything you've got. Excel works too, though it gets messy quick once you add more data. Qlik Sense is solid if you need something more specialized. Honestly, I'd just start with whatever your team already knows how to use. Getting people to actually adopt new tools is half the battle anyway. You can always upgrade later once you figure out what you really need.
Honestly, these dashboards are a game changer - you get real-time data on your whole supply chain so problems don't blindside you anymore. Track delivery performance, inventory turnover, transportation costs, all that stuff in one spot. Makes decision-making way faster than waiting around for weekly reports or just winging it. I'd probably get a little obsessed checking it constantly, not gonna lie. Best approach? Pick your biggest 3-5 headaches first and build around those specific metrics. Way less overwhelming than trying to track everything at once.
So predictive analytics basically turns your KPI dashboard from just showing old data into actually forecasting what's coming. You'll see demand patterns ahead of time, predict inventory shortages, spot supplier issues before they mess you up. Game changer, honestly. Instead of always playing catch-up, you're planning ahead. Start with your biggest headaches - like if inventory's always your problem, build models around that first. Short bursts work better than trying to predict everything at once. The whole thing shifts from "here's what broke last week" to "here's what might break next month."
Focus on delivery performance first - are they hitting deadlines? Quality stuff like defect rates matters too, obviously. Cost variance is huge, but don't forget response time when shit hits the fan. That's honestly what separates good suppliers from great ones. Lead times are critical if your demand's all over the place. Set up alerts for when these metrics go wonky - you want to catch problems early instead of just staring at dashboards all day. Total cost of ownership gives you the real picture beyond just unit price.
Honestly, pulling data from sales, finance, procurement, and ops transforms your dashboard completely. You'll actually see the full picture instead of random isolated numbers. So instead of just inventory levels, you're connecting sales forecasts with procurement costs and delivery performance. Game changer! It's like having all the puzzle pieces finally - you can catch bottlenecks early and predict problems before customers even notice. Make decisions based on real context, not departmental tunnel vision. Oh, and start by figuring out which teams have data that actually impacts your supply chain stuff.
Honestly, just put the stuff people check every day right at the top - inventory levels, how deliveries are going, cost issues. Nobody wants to scroll through a million spreadsheets, so use those visual charts and gauges instead. Group similar things together and pick consistent colors so it doesn't look like a rainbow threw up on your screen. The drill-down feature is clutch when something goes wrong and you need details fast. Oh, and definitely get some actual users to test it first - they'll roast you for anything that doesn't make sense, but that's way better than launching something nobody uses.
Start with data governance on day one - figure out who owns what and set up validation rules. I've watched so many pretty dashboards crumble because they're built on trash data, which honestly is worse than no dashboard at all. Pull from single sources of truth for each metric. Set up automated checks that catch weird stuff before it hits your dashboard. Someone should manually spot-check numbers against reality - sounds boring but it'll save your butt later. Oh, and document where your data comes from so you can actually trace problems when they pop up.
Track your on-time delivery rates and inventory turnover first - those two tell you everything about whether you're keeping up. Order fulfillment cycle times matter too. Cost per order and supplier performance scores are obvious ones, plus how often you're running out of stock (that one's painful when it happens). Perfect order rate is honestly my favorite metric since it rolls delivery, quality, and accuracy together. Oh, and demand forecasting accuracy - because if you can't predict what's coming, good luck with the rest. Set up dashboards with clear red/green zones so problems jump out at you.
So basically you use the same data but show different stuff to different people. C-suite wants those big picture cost summaries. Operations managers? They're glued to inventory levels and delivery stats all day. Procurement lives for supplier scorecards - seriously, they get weirdly excited about vendor performance data. Sales teams need the demand forecasting and stock info. The trick is customizing how everything looks. Different layouts, timeframes, what they can click into. I'd start by just asking each team what decisions they make daily, then build dashboards around that. Way easier than guessing what they actually use.
-
Use of different colors is good. It's simple and attractive.
-
Perfect template with attractive color combination.