


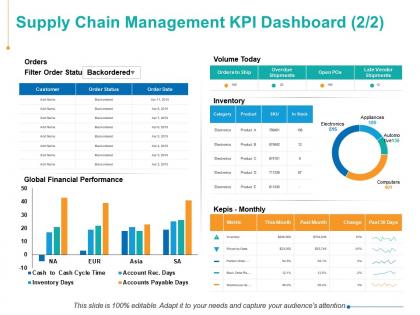
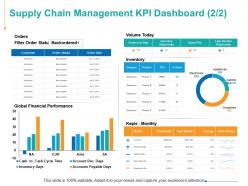
Supply chain management kpi dashboard finance ppt powerpoint presentation files




Try Before you Buy Download Free Sample Product
 Impress Your
 Audience
 100%
100% Editable
 Save Hours
 of Time


Handle any impasse with our Supply Chain Management KPI Dashboard Finance Ppt Powerpoint Presentation Files. Enable folks to find an acceptable answer.
People who downloaded this PowerPoint presentation also viewed the following :
Supply chain management kpi dashboard finance ppt powerpoint presentation files with all 5 slides:
In your time of need our Supply Chain Management KPI Dashboard Finance Ppt Powerpoint Presentation Files are on hand for your design demands. Thousands of designs at your fingertips.
FAQs for Supply chain management kpi dashboard finance ppt
You'll want to track inventory turnover first - that's like your bread and butter metric. On-time delivery rates and order fulfillment accuracy are obvious must-haves too. Cash-to-cash cycle time is honestly underrated but shows how fast you're turning inventory back into actual money. Lead times matter, plus supplier performance scores. Oh, and demand forecasting accuracy - trust me, getting that right saves you tons of pain later. Cost per order and supply chain costs as percentage of revenue round out the basics. Start there, then pile on whatever weird industry-specific stuff your boss actually looks at.
Honestly, visualization tools are total lifesavers for supply chain chaos. Your data stops being this overwhelming mess of spreadsheets and actually makes sense - you'll see charts and heat maps that instantly show bottlenecks or which suppliers keep screwing you over. Heat maps especially are clutch for catching patterns you'd never spot otherwise. Seasonal trends become obvious, problem areas jump right out. I swear by dashboards that let you zoom from the big picture down to specific issues when something's going sideways. Just pick the right format for each metric and you're golden.
You absolutely need real-time data for your SCM dashboard. Supply chains are brutal - one hiccup snowballs into chaos fast. When a supplier goes down, you've got maybe minutes to pivot to backups or tweak production. Historical stuff is fine for spotting patterns, but it won't save you when things go sideways. I learned this the hard way watching teams scramble over weekend outages they found out about Monday morning. Set your refresh rates aggressive and get those alerts dialed in. Trust me, catching problems as they happen vs. playing cleanup later? Total game changer.
Figure out what's actually breaking first - late deliveries, too much inventory sitting around, unreliable suppliers, whatever. Build your dashboard around those specific headaches instead of some cookie-cutter template. Constantly running out of stock? Focus on inventory turnover and how well you're predicting demand. Suppliers driving you nuts (which honestly happens to everyone)? Track their performance and how much lead times bounce around. The whole point is setting up widgets and alerts for stuff that actually matters to your day-to-day chaos. Don't track metrics just because they look fancy - track what'll fix your real problems.
So first thing - get your data integration sorted with something like MuleSoft or Informatica to pull from your ERP, WMS, TMS systems. For visualization, Tableau and Power BI are solid choices, though D3.js is cool if your team's into that. You'll definitely need cloud infrastructure - AWS or Azure, doesn't really matter which. APIs are basically what connects everything, so don't skip those. Oh and set up proper data warehousing early or you'll hate yourself later when everything's a mess. Honestly, I'd tackle the data sources first then work outward from there.
Honestly, I'd start with forecasting widgets that pull from your historical KPI data - demand forecasting, inventory gaps, that kind of stuff. Tools like Tableau and Power BI already have ML built in, which is pretty convenient. Connect your real-time supply chain feeds to algorithms that can spot patterns and predict 3-6 months out. Don't go crazy at first though. Maybe just tackle demand prediction for your biggest SKUs? Set up alerts when predictions cross certain thresholds so your team can adjust procurement before things get messy. Way easier than scrambling after the fact.
Honestly, the worst thing you can do is cram like 20 metrics on one screen - instant headache for everyone. Skip the "oops we were late last month" stuff too since that doesn't help anyone fix anything now. You want metrics that actually let people catch problems before they happen. Oh and don't give your warehouse guy the same dashboard as your CEO, they care about totally different things. I'd start with maybe 5 key metrics max. Once people are actually checking it regularly, then you can add more. Simple beats comprehensive every time.
Look, a KPI dashboard basically shows everyone how your supply chain stuff actually affects the big picture business goals. Track delivery performance against customer happiness, or inventory costs versus profit targets. It's like being a translator between operations and what executives actually give a shit about, you know? Once people can see that supply chain efficiency = more revenue or lower costs, suddenly everyone's on board. Oh and definitely set up regular check-ins to walk stakeholders through these connections - makes a huge difference in getting buy-in.
Honestly, just focus on these six and you'll be golden: inventory turnover, order fulfillment rate, and supplier performance metrics first. Those three alone show you like 80% of your operational health. Then add on-time delivery percentage and total supply chain costs - both are huge. Days sales outstanding is worth tracking too, plus stockout frequency because trust me, running out of inventory during busy season is a nightmare. I learned that one the hard way! Start simple with these core ones. You can always get fancier with more detailed KPIs once you've got the basics down.
Honestly, shared KPI dashboards are game-changers because everyone sees the exact same data. No more of those cringe meetings where finance says one thing and ops says another - you know how painful those get. Operations, procurement, logistics, they're all looking at the same real-time metrics. Bottlenecks become obvious super fast since other teams immediately see the ripple effects. There's this built-in accountability too since your team's performance is right there for everyone to see. I'd pick maybe 3-5 metrics that multiple departments actually care about (not just vanity numbers) and start there.
So KPI dashboards are like having a really good early warning system for your supply chain. They show you stuff like cycle times and inventory levels visually, which makes problems way easier to catch. When lead times start getting weird or inventory starts backing up somewhere, you'll see it right away instead of finding out weeks later. The drill-down feature is honestly pretty sweet - you can go from the big picture to specific suppliers or processes. Just set up alerts for when things hit certain numbers, that way you're not constantly staring at screens. Catches problems before they snowball into bigger headaches.
Set up weekly reviews for day-to-day stuff, monthly for bigger picture metrics. Automate your data feeds if you can - nobody remembers to update dashboards manually, seriously. Every quarter, take a step back and ask if you're tracking the right things. Bad data will mess up everything, so build in some quality checks. Oh, and actually talk to the people using this dashboard daily - they'll tell you what's broken way faster than any report will. Short sentences work. But mix in some longer ones that flow naturally when you're explaining the process.
Look at what's actually making your life hell first - those metrics that have you stressed when they tank. Go for 5-7 core ones that hit customer happiness and costs hard: on-time delivery, inventory turnover, order accuracy, lead times. Those usually matter most. Honestly, don't fall for the shiny metrics that look cool but won't change how you make decisions. I've watched so many dashboards become total wastelands where people track everything and act on nothing. Find what your leadership reviews every week, nail those first. You can always add more once you've shown this stuff actually works.
Honestly, user feedback is what makes or breaks your SCM dashboard. Ask your stakeholders monthly what metrics they're missing and which visuals are confusing them. Most people build these things thinking they know what users want, but you'll be surprised how wrong you are. Quick surveys work too if meetings are a pain. The key is finding out how they're actually using the data day-to-day. Otherwise you'll end up with something that looks nice but sits there collecting digital dust. Their input shows you the real gaps between what you built and what they need to get work done.
Honestly, dashboards work because there's no hiding from the numbers - everyone can see who's crushing it and who's struggling. When your metrics are up there for the whole team to see, people naturally step up their game. Real-time data means nobody gets to play dumb about missed deadlines or problems anymore. It's kind of like peer pressure but in a good way? The visibility actually makes people want to do better. I'd suggest doing weekly reviews where each person goes through their numbers and explains what went wrong with the red stuff.
No Reviews