It’s time to dump spreadsheets and move to waterfalls or even donuts for that matter to show your data in ways that people absolutely adore!
Have you ever noticed that people often groan when a spreadsheet pops up in front of them sharing brilliant data insights? No matter how useful the insights are, the reaction isn’t what a presenter wants. Rather it is far away from his imagination. Maybe it’s not the audience- or the presenter- to blame. Maybe it is the old school method that is the real culprit. Or maybe the presenter suffers from Dumb-and-Overused-Chart-Syndrome?
Haven’t heard of this syndrome before? Unfortunately without even realizing, many presenters are suffering from this so-called syndrome wherein the charts and graphs aren’t engaging enough, thus yielding a negative reaction from the audience- groans, yawns-all at once!
Here are 30 excel linked data-driven PowerPoint slides and templates that can help in presenting data in a clever way and up your data visualization game. These charts don’t require the audience to squint; instead, they act as data visualizations tools and do the same that a photo does to everything else: Show not tell!
So, now you can stop boring your audience with the same old-school spreadsheets and try serving them some Donuts, Waterfall, Bubbles, so on and so forth.
Trust me it is more fun, and if you are still not convinced. Try it for yourself!
P.S- All these charts are data-driven and excel-linked, taking your presenting game a notch higher.
Top 30 Excel Linked Data-Driven PowerPoint Slides and Templates
Tornado Chart For Population Excel Chart Template 1
The core of every business’s success lies in properly analyzing the data and using it to one’s advantage. Each high-quality presentation should show reliable research and analysis. We have designed this tornado chart to help you illustrate trends more easily and show important relationships between the population of males and females in a country or workplace. This diagram is a uniquely designed bar chart that performs sensitivity analysis, thus making it ideal to be presented in front of anybody depending upon your needs and requirements. Since this, a data-driven Excel linked chart you will face no difficulty in tailoring it to your current preferences.
Download Tornado Chart For Population Pyramid Excel Chart PowerPoint Layout
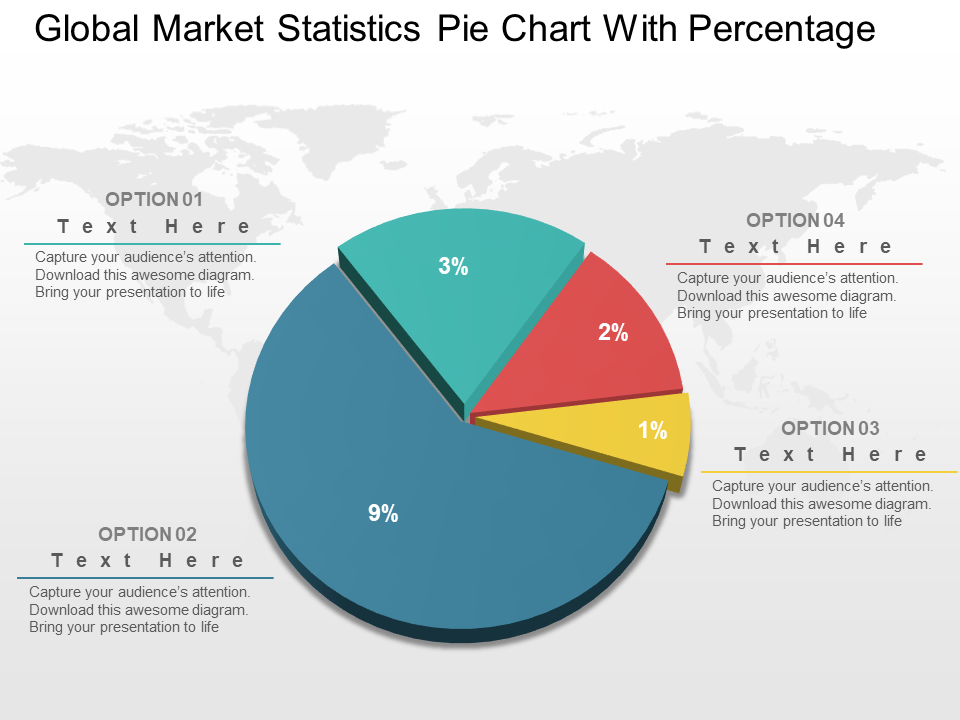
Global Market Statistics Pie Chart With Percentage Template 2
Visualize and compare various proportions of categories with this pie chart template. Divide categories into segments showing how individual components contribute to the total. This is an effective data visualization chart that can be used to process data efficiently. You can show various combinations of numerical data with this template that is data-driven, thus making editing and adding your personalized data a breeze. Besides this, it is the most compatible set to present a small amount of data that can be easily comprehended by the viewer.
Download Global Market Statistics Pie Chart With Percentage PowerPoint Slides
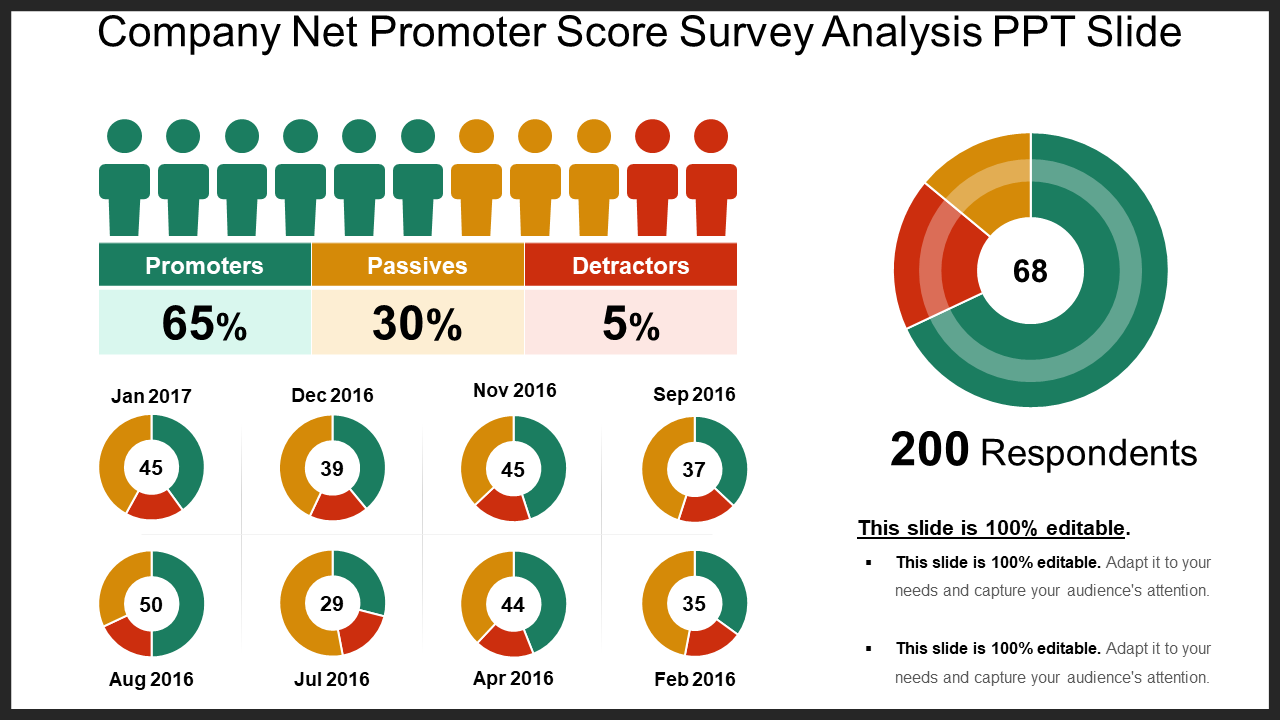
Company Net Promoter Score Template 3
Analyze customer satisfaction and promotional score with this template. This template is great for sales and marketing professionals looking for effective ways to explain the NPS in a seamless manner. This template has a diverse collection of data-driven chart illustrations that can help in depicting various components of NPS like the total number of respondents, active users, passive users, and others. Not only this, but it can also be used to present any information, visually that can be easily altered to fit your needs and requirements. Simply add your preferable data and edit this template on the go.
Download Company Net Promoter Score Survey Analysis PPT Slide
Globe With Bar Graph Data-Driven Success Template 4
It doesn’t matter if you're an HR executive, manager, entrepreneur of any other individual this chart template can be used by anybody time and again to present complex data. The data presented using this chart is very easily understandable and can be retained by the audience for a long period of time, hence individuals belonging to any sector can benefit from this template. Besides this, it is great to present demographic information with ease as it is a fully editable layout. Its data-driven quality gives you enough scope to add your personalized data and present it in a seamless manner.
Download Globe With Bar Graph Data Driven Success Indication PowerPoint Slides
Data Comparison Chart Template 5
Compare and visualize two sets of data with this template. Use it to show a comparison between products, gender, etc. The applications of this template are multiple hence it can be used to visualize all forms of data comparisons. Presented in the form of vertical and horizontal bar graphs this template provides a clear view of the comparison, thus making the judgment regarding the aspects very easy for the user and viewer as well.
Download Data Comparison Chart PowerPoint Slide
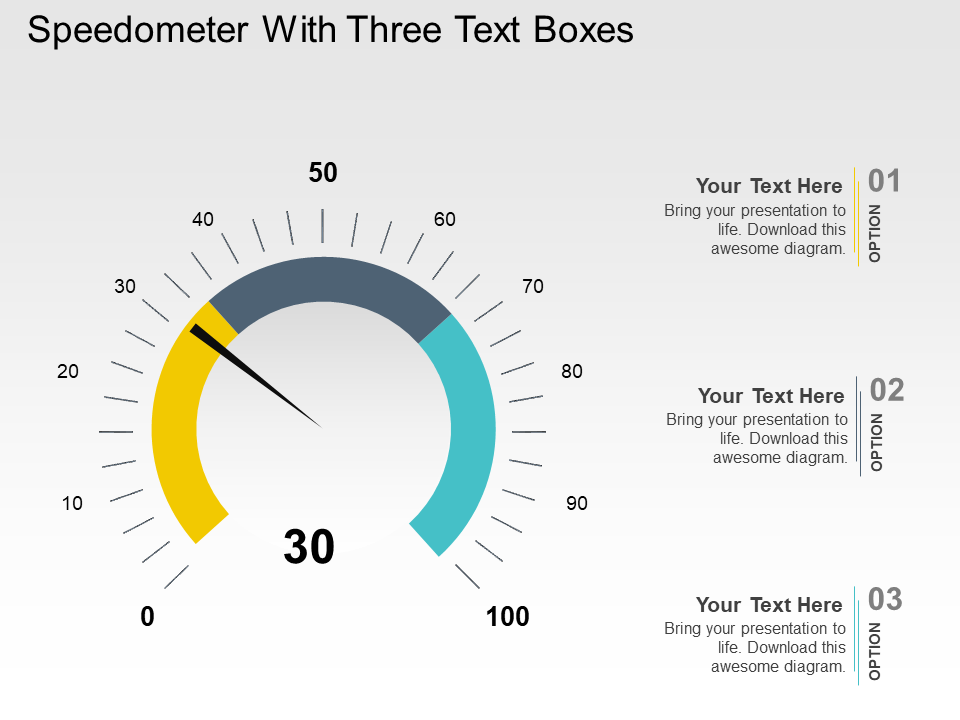
Speedometer With Three Text Boxes Template 6
This is a fully editable speedometer design that can be incorporated in any of your dashboards or used individually to present data in a seamless manner. It functions well in business presentations as it is easily comprehended by the audience. You can use it to indicate the performance level, tasks completed, reporting the status of the project, etc. The set is completely user friendly and made with high-resolution images that make the presentation of KPI’s very easy and convenient for the user.
Download Speedometer With Three Text Boxes PowerPoint Slides
Data-Driven Human Resource Management Template 7
This is a very creative template that can be used to show any data analysis depending upon the needs and requirements of the user. It is also a data-driven chart, hence you will face no difficulty in adapting it to any data analysis whether it is related to any field business, marketing, sales, or any other. It all depends on the requirements of the user which is efficiently fulfilled with this colorful template.
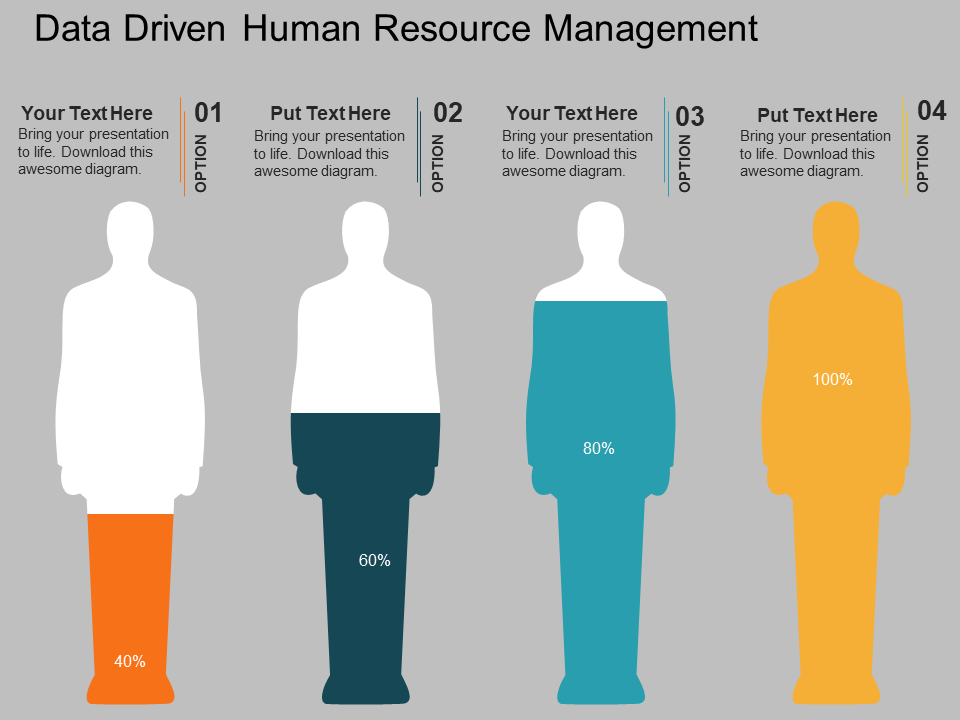 Download Data Driven Human Resource Management PowerPoint Slides
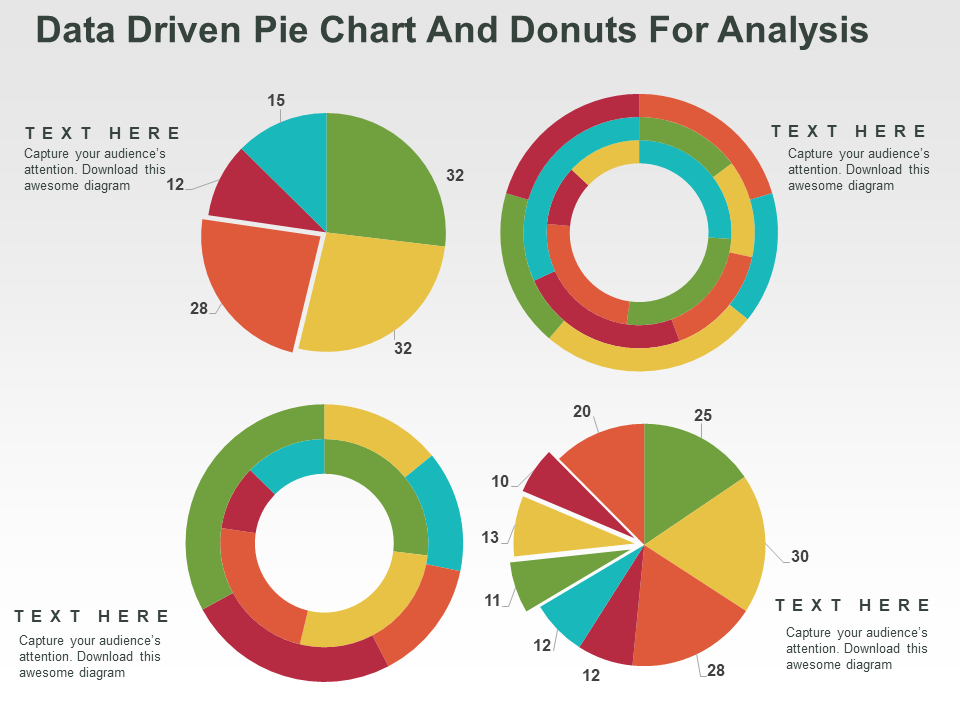
Data-Driven Pie Chart And Donuts For Analysis Template 8
This template is apt to present an analysis of demographic spread, global market, economic factors, and others. The chart uses a minimalist approach making it visually appealing and comprehensive. It is also a well-accepted layout in the business field to report, show percentage reviews, market share analysis, etc. Users can make use of this template to show a multitude of statistics depending upon the needs and requirements of their business. Built with user focus friendliness, this template can be used to present quality presentations to the audience.
Download Data Driven Pie Chart And Donuts For Analysis PowerPoint Slides
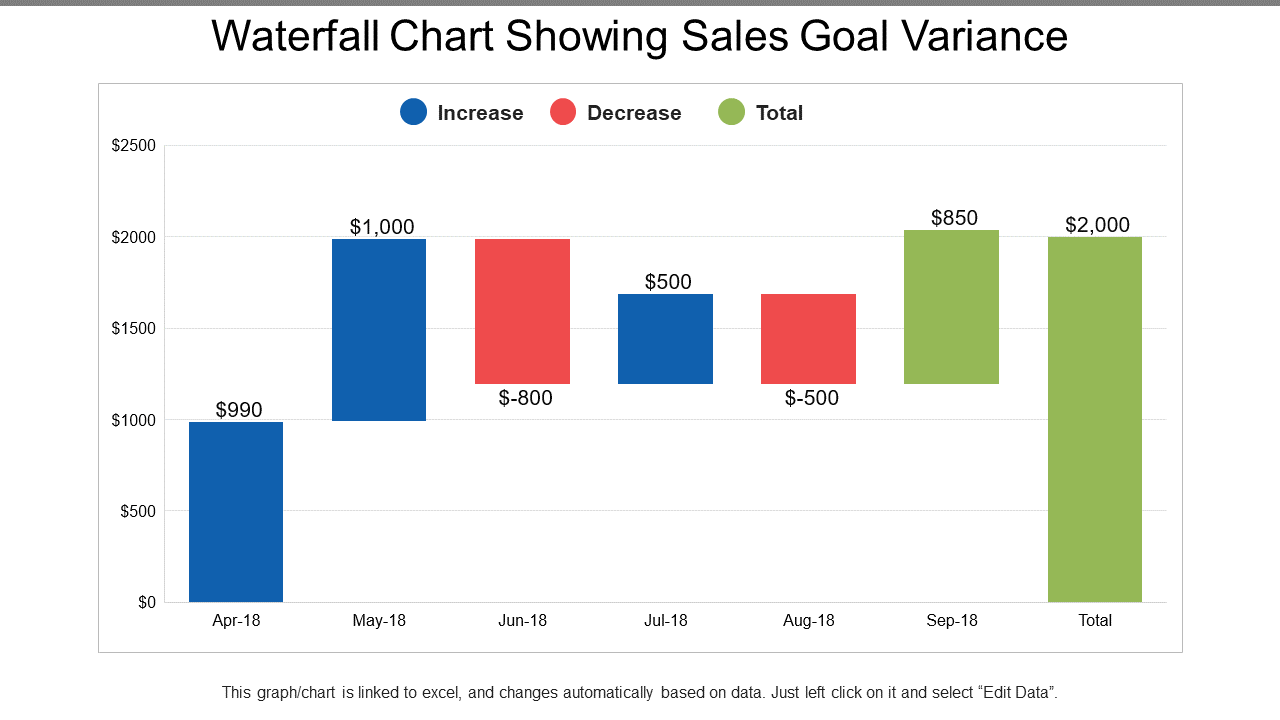
Waterfall Chart Showing Sales Goal Variance Template 9
This waterfall chart template is useful to get a quick overview of sales goals of your organization. It can be used to show both positive and negative values over a period of time. It can also be used to point out the initial and end values of the sales goals that can be altered as per one’s needs and requirements. Since this is a data-driven chart you will face no difficulty in modifying the data as per your presentation demands.
Download Waterfall Chart Showing Sales Goal Variance
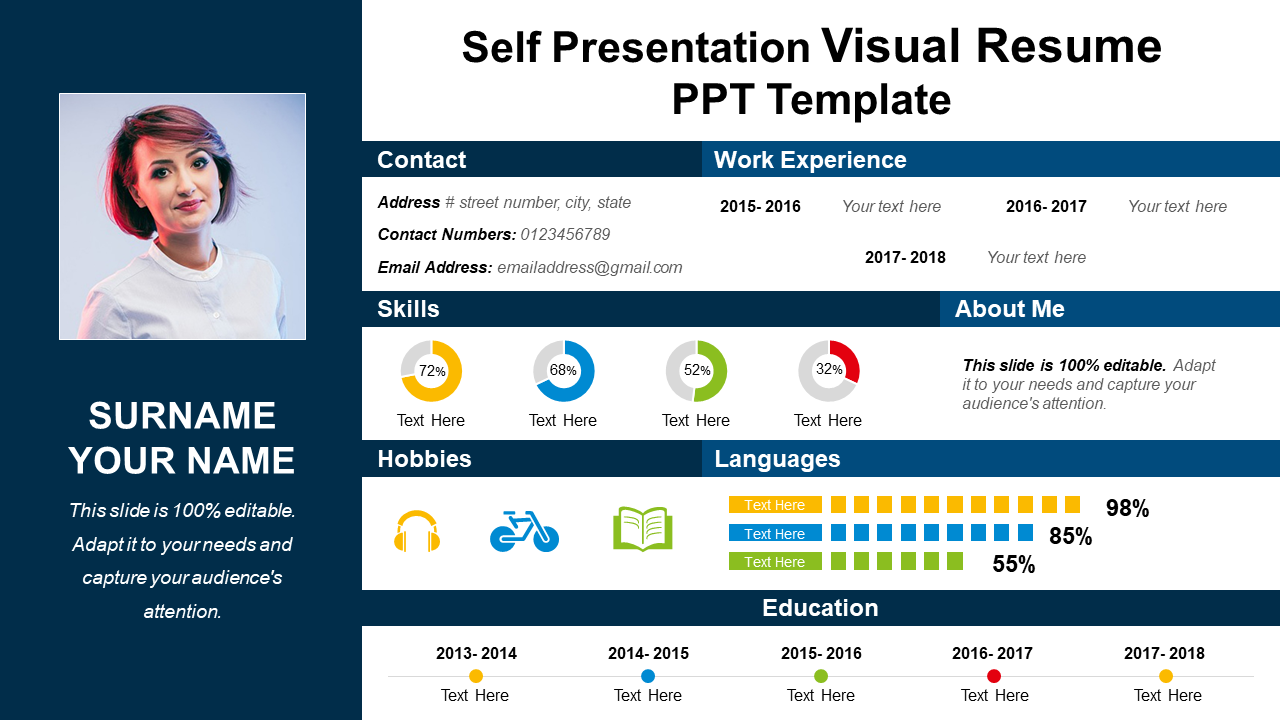
Self Presentation Visual Resume PPT Template 10
Are you applying for a new job position wherein you need to stand out from the rest of the candidates? Make use of this visual resume template with data-driven charts and graphs, that offer a unique way of presenting your abilities, skills, qualifications, previous employment history, and other aspects of your personality. These charts and graphs provide an at-a-glance view of the jobseeker’s qualities, thus helping them get noticed. Also, this template is designed to fit your creative aesthetic style by using professional colors and high-quality images making it easily shareable.
Download Self Presentation Visual Resume PPT Template
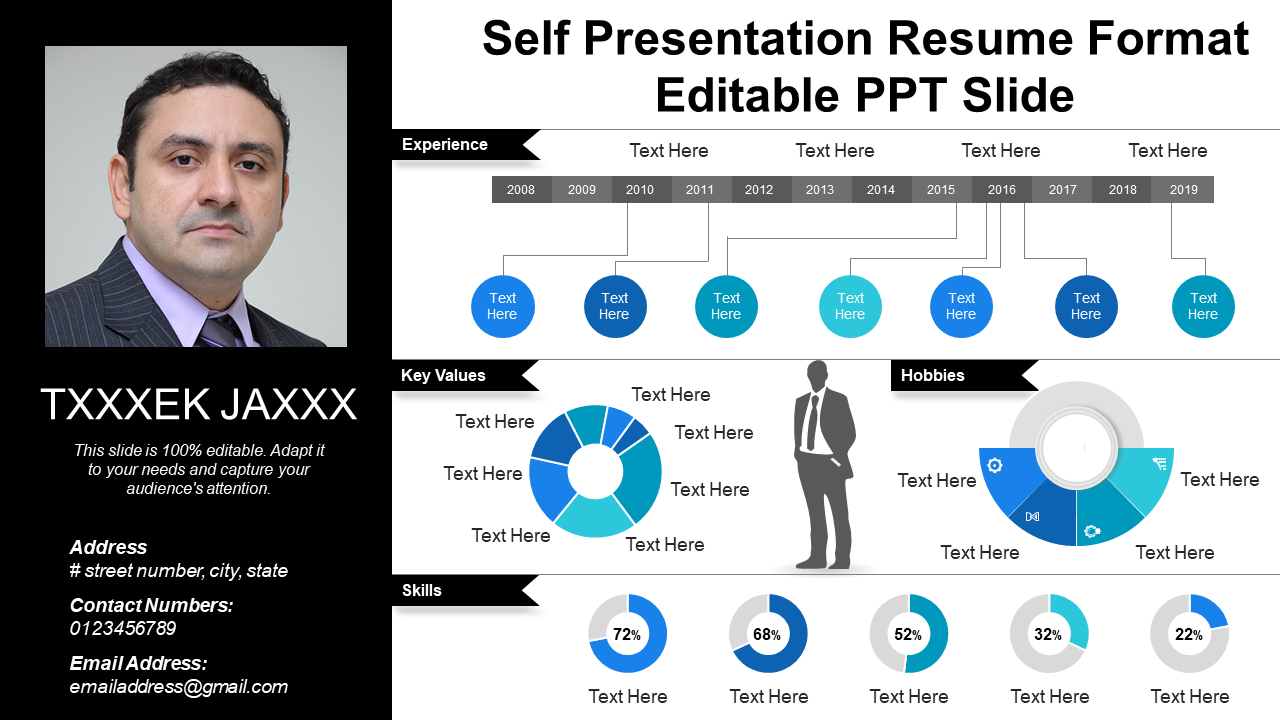
Self Presentation Resume Format Template 11
Want a resume that leaves an everlasting impression on the employer? This set comes in handy with its data-driven content and other attributes. It comes in a uniquely designed, clean infographic layout that offers a host of benefits to the job seeker in terms of bagging great employment opportunities. Its automatic updation quality helps the user to present his preferred data in a pleasing manner, thus helping his job application stand out from the rest. This template is Excel linked so sharing it and editing it is very easy and convenient.
Download Self Presentation Resume Format Editable PPT Slide
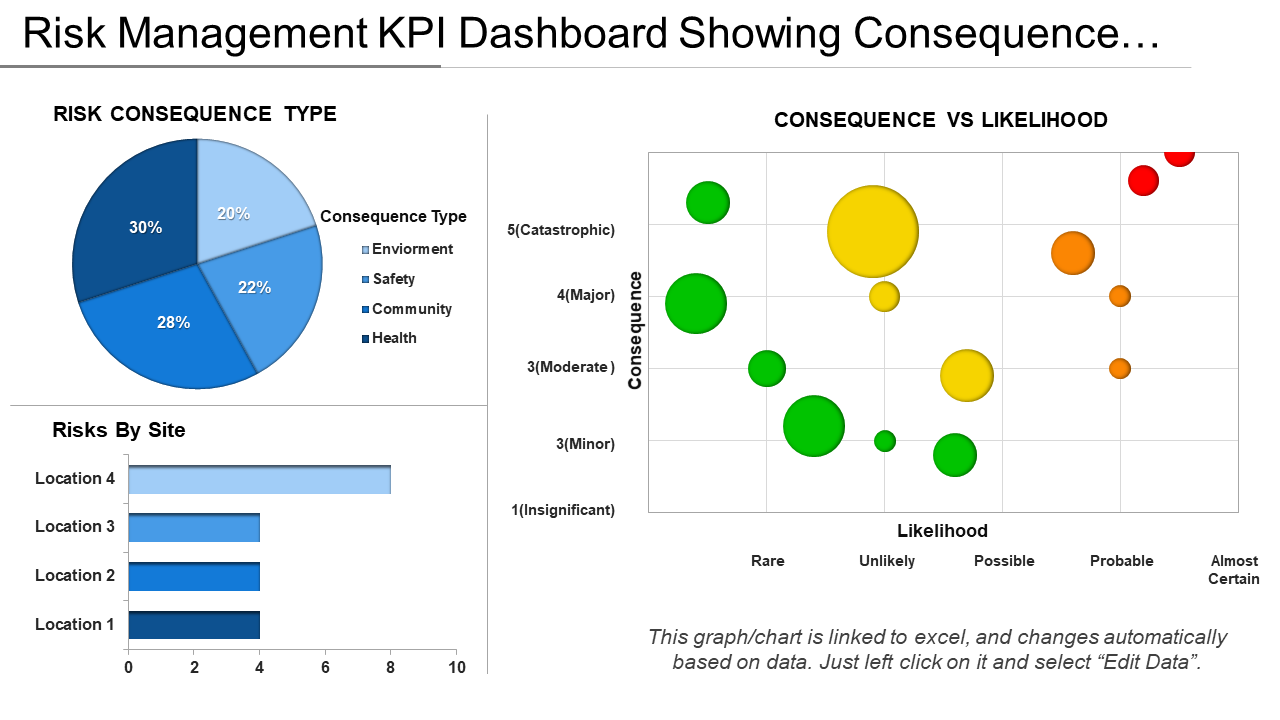
Risk Management KPI Dashboard Template 12
Risk management is the most crucial vertical to mitigate risks. This risk management kpi dashboard template acts as a resourceful tool that can be used to identify, monitor, and minimize various kinds of risks as it provides useful information in the form of a snapshot. As such anybody can easily understand the trends of risk mitigation, thus making this design an ideal set. Professionals belonging to any sector can use this template to provide all sorts of information about adverse conditions, unforeseen events, and others that are to be measured and monitored continuously.
Download Risk Management KPI Dashboard Showing Consequence Vs Likelihood
Data-Driven 3D Interactive Bubble Chart Template 13
Uplift the overall aesthetic appeal of your boring slideshows with this bubble chart template. Present any form of data that you wish to with this data-driven chart that responds to every need of the user. Since this chart offers a wide range of applications it can be used by any professional to represent complex data in an easily understandable manner. Also, the data presented with this template can be easily retained by the audience making it beneficial for any individual downloading it.
Download Data-Driven 3D Interactive Bubble Chart PowerPoint slides
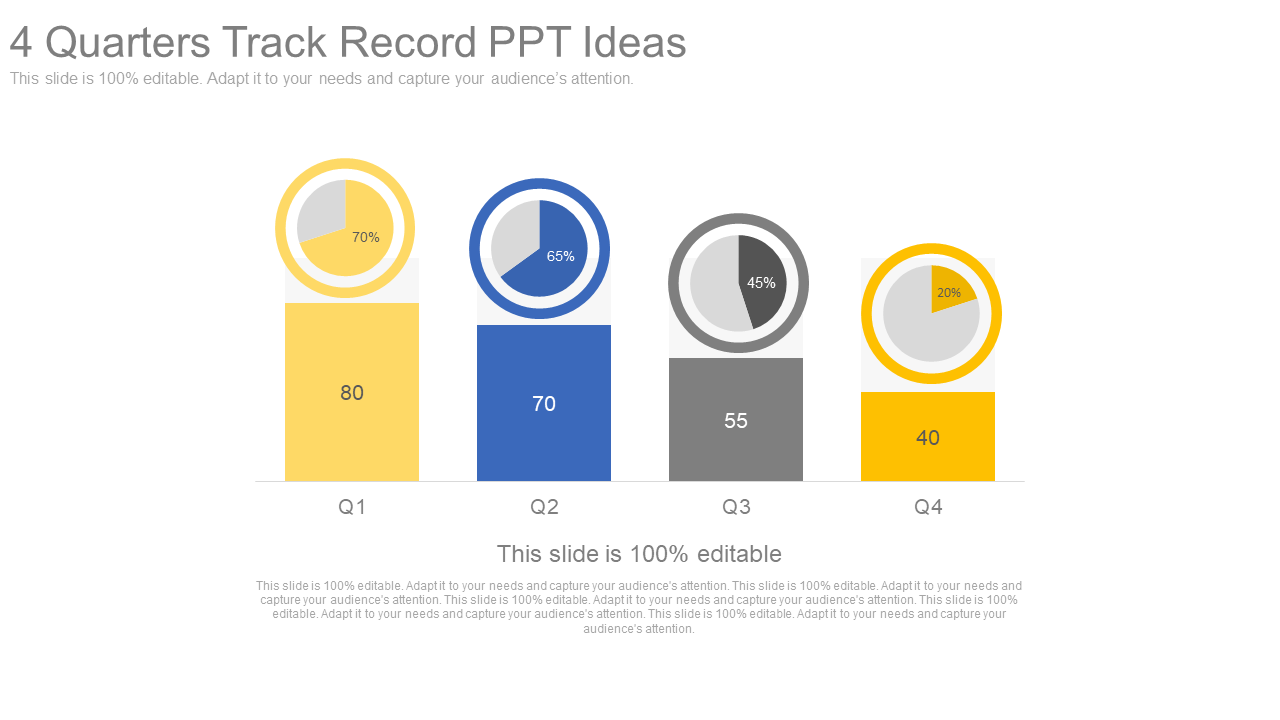
4 Quarters Track Record Template 14
Show various combinations of data analysis with this template. It can be used by HR, entrepreneurs, executives, team leaders or any other person to showcase data in a visually attractive way. Employ this chart to show quarterly track records of sales, marketing, or any other department. This is not a topic-specific template, hence any sector can benefit from it. Also, its data-driven quality enhances its versatility and flexibility as well.
Download 4 Quarters Track Record PPT Ideas
Key Performance Indicators Template 15
KPI’s are crucial to measuring the success of a project, tasks, organization etc. over a given period of time. You can use this template to measure the performance of your organization. Use it to analyze and measure various performance parameters with a single layout. Featuring all kinds of data-driven charts and graphs this template makes viewing the overall performance of the organization very easy and convenient. Hence, it can be used by project managers, strategists, or any other person. All you have to do is download this design, add your data, and see the charts getting altered.
Download Key Performance Indicators Template PowerPoint Slide Show
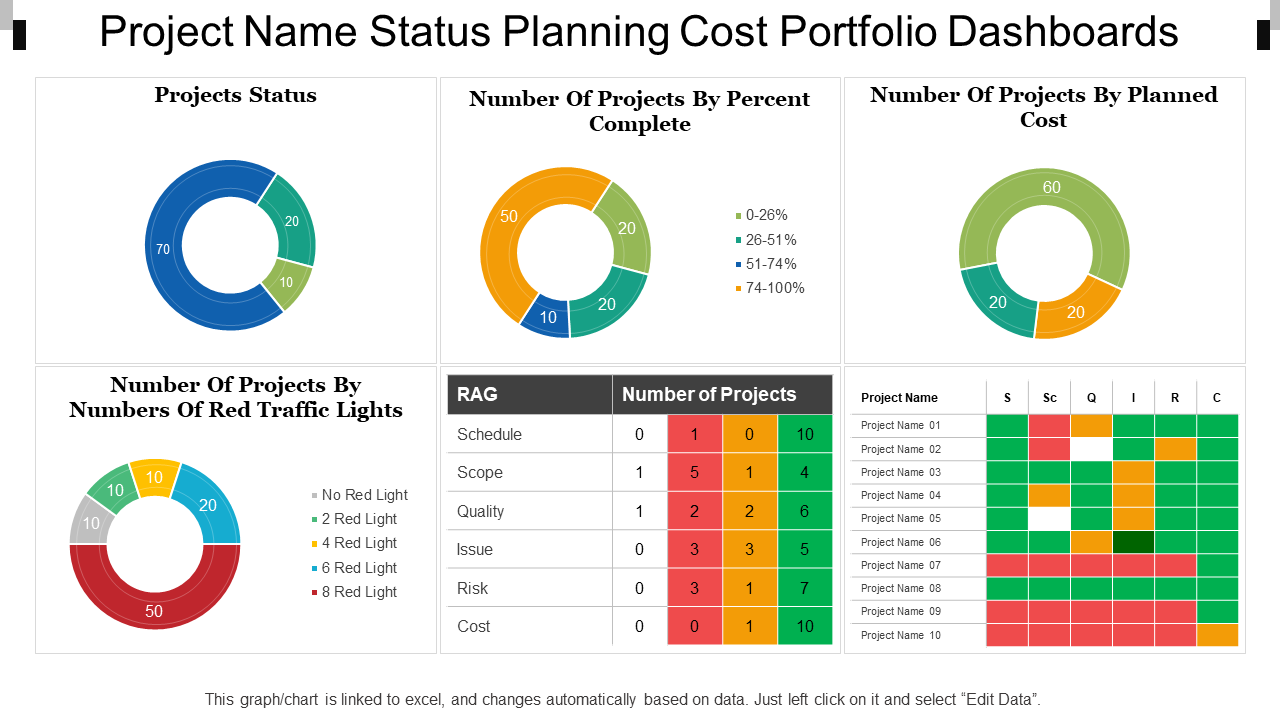
Project Name Status Planning Dashboards Template 16
This project dashboard is ideal for departments or executives to monitor the status of the campaigns, number of projects completed, number of projects planned, their cost, and similar other details. It also contributes to making the organization more intelligent towards attaining its goal as everything can be viewed at a single glance. Besides this, share important information or metrics with this template as it is easily comprehensible making it useful for business owners, project managers, team leaders, and others. It is data-driven which makes it easy to alter and create a well-prepared slideshow in no time.
Download Project Name Status Planning Cost Portfolio Dashboards
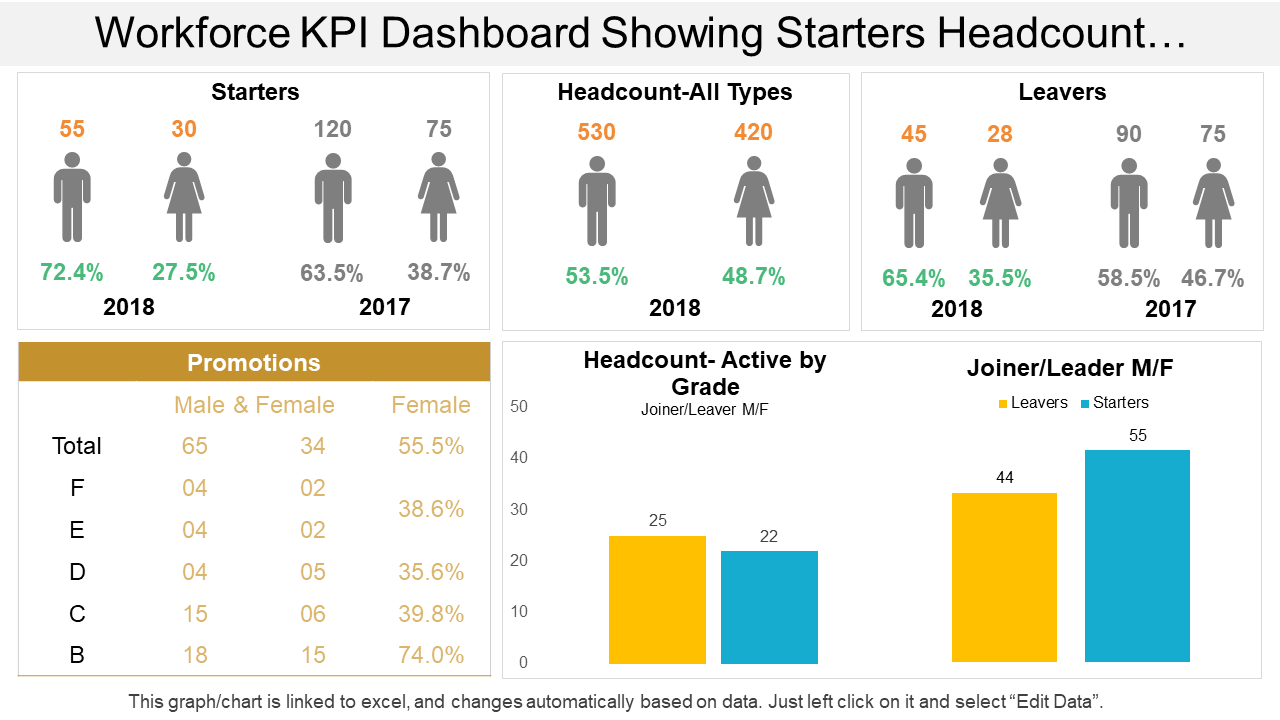
Workforce KPI Dashboard Template 17
This template is apt to keep a headcount of your workforce whether they are males or females. Keep track of everything pertaining to the employees such as when they started or left the organization, promotions given, grade-wise headcount, etc. This is a dashboard template showing various forms of data-driven charts that function as great visualization tools. As such everything related to the employees can be monitored at a glance, with this template. Besides this, it functions well for every organization because of its versatility.
Download Workforce KPI Dashboard Showing Starters Headcount Leavers Promotions And Joiners
Website Performance Review Template 18
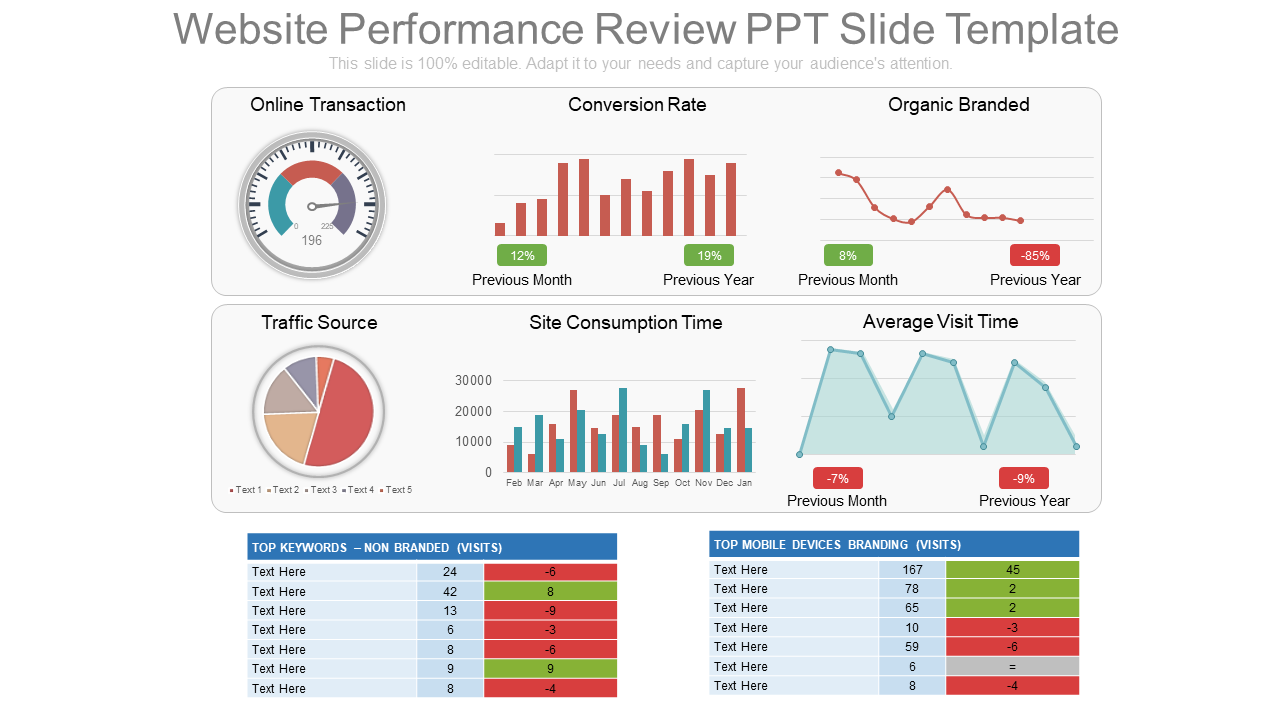
Monitor website performance by tracking important metrics like online transactions, traffic source, site consumption time, and others. This is an important tool to collect, measure, and analyze data for your website that is data-driven. Hence, it will get automatically updated as soon as you add your data to it. This template can be used in many different contexts like social media marketing, digital marketing, SEO, eCommerce, and others. Since it provides a broad spectrum view of website KPI’s it will be useful for any organization or agency no matter how small or big it is.
Download Website Performance Review PPT Slide Template
Achieving Sales Target Sales Performance And Sales KPI Dashboard Template 19
Measure sales KPIs with a birds-eye view using this template. This template can be used to view key sales indicators to achieve organizational goals more efficiently. This includes metrics like weekly sales, product inventory, net sales, and many others that can be modified as per the liking of the user. Besides this data collected from various sources can be presented with this template to generate actionable insights at a much faster rate.
Download Achieving Sales Target Sales Performance And Sales KPI Dashboard PPT Icon
Data-Driven Sales KPI Dashboard Template 20
Executives who want an at-a-glance view of the sales will appreciate this professionally designed template. Showcase various sale scenarios and their corresponding data such as monthly sales, sales volume, through monthly sales comparison and others. This template provides insights into critical sales material without cluttering up the layout. Also, each chart in this template is Excel linked hence you will face no difficulty in altering the data as per your needs and requirements.
Download Data-Driven Sales KPI Dashboard For Achieving Sales Target PPT Samples
Financial Performance KPI Dashboard Template 21
This is a high-level snapshot of the financial health of your company that will help you in making responsible decisions. Use it to decide about the various resources and their proper allocation so that they prove advantageous for the company and its finances. This template covers various aspects of financial performance such as vendor expenses, payroll headcount ratio, fundraiser expenses, sales conversions and others that can be easily altered as per one’s liking. It summarizes and interprets the numbers in a very easy format that can be easily understood by the people viewing it, thus making it a highly resourceful data visualization tool.
Download Financial Performance KPI Dashboard
Project Status KPI Dashboard Template 22
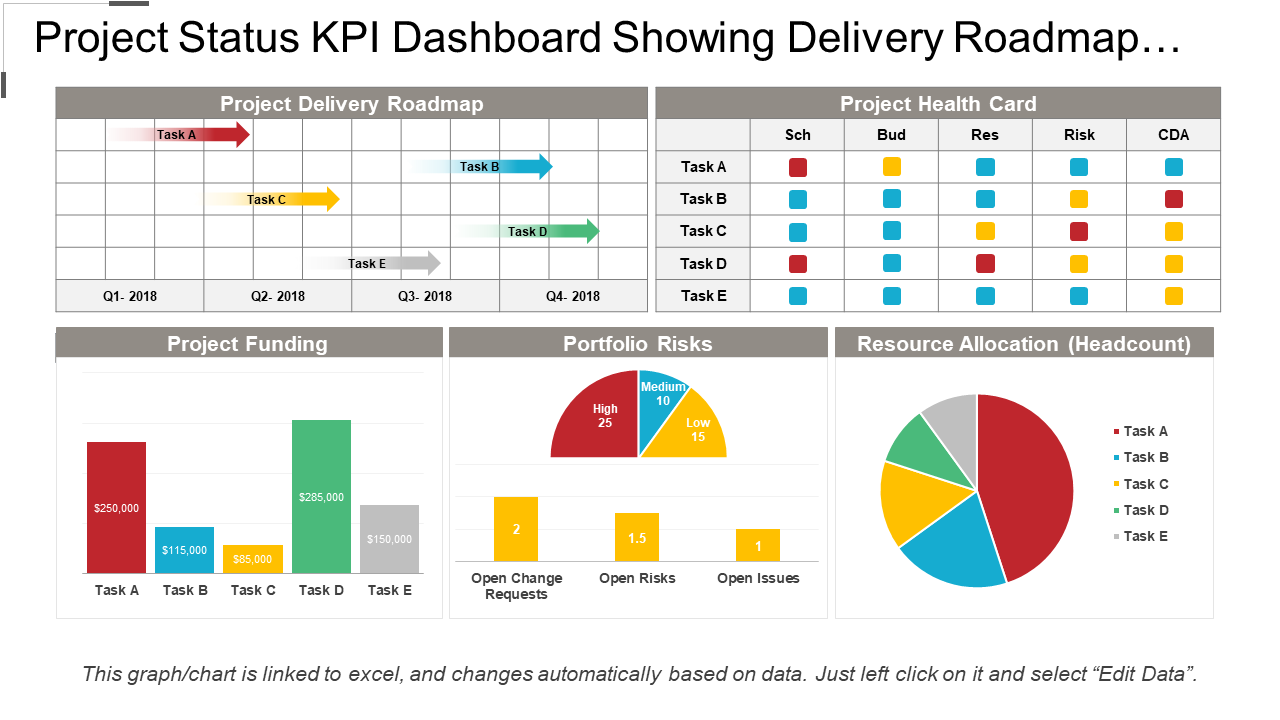
This is a data-driven project status template that displays important statistics, metrics, data, and other aspects related to the health of the project. It provides a mix of various KPIs related to the project thus enhancing the overall decision-making ability of the project managers, executives, or any other individual who downloads this template. Besides this, it is a user-friendly layout that includes high-resolution charts and graphs that can be altered as per one’s desire.
Download Project Status KPI Dashboard Showing Delivery Roadmap And Resource Allocation
Workforce At A Glance PowerPoint Slide Template 23
This is a very widely used tool that helps in visualizing relevant Key Performance Indicators related to HR functions. Key performance metrics and data such as part-time staff, full-time staff, male-female ratio of the employees, etc. can be efficiently displayed with easy to understand charts and graphs used in this layout. This is a ready-made template that is 100% customizable, owing to the feature of being Excel linked.
Download Workforce At A Glance PowerPoint Slide Graphics
Procurement KPI Dashboard Template 24
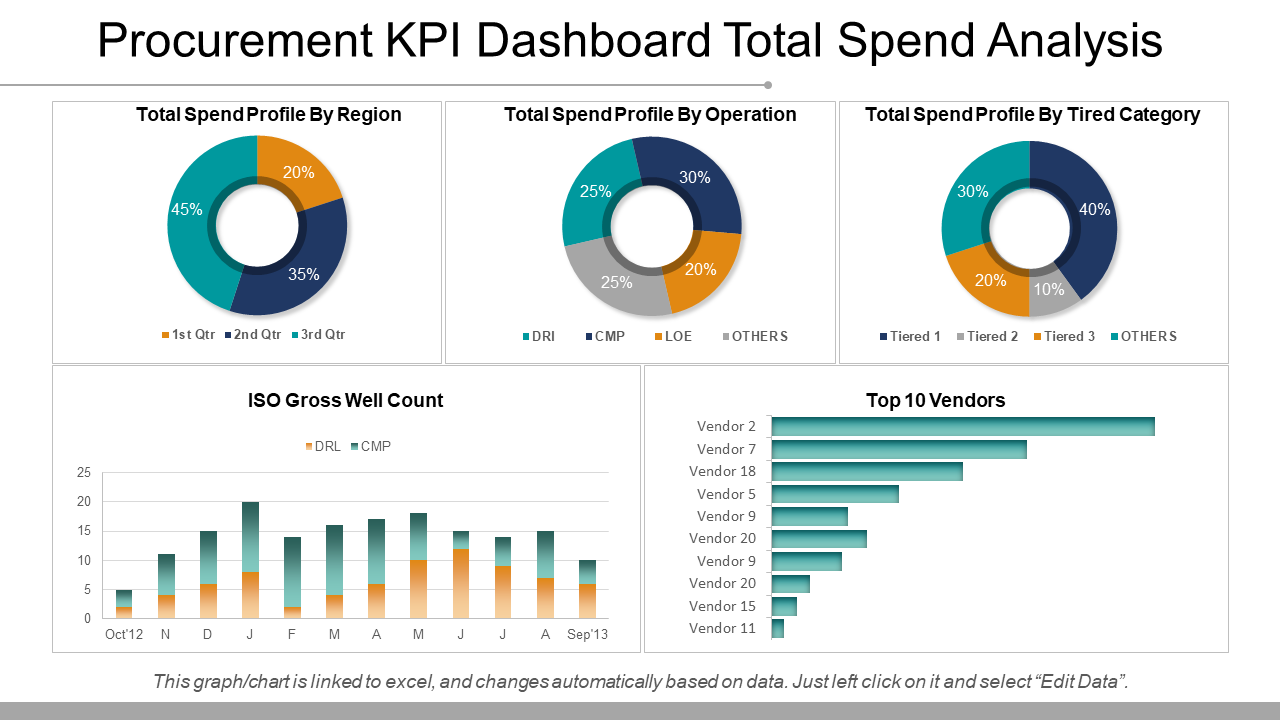
This dashboard helps in keeping track of all the procuring activities with relevant and measurable metrics such as total spend profile by region, total spend profile by operation, top vendors, and many more. It provides a benchmark that can be used to analyze the quality of the warehouse and vendor from which the material has been procured. Numerous KPI’s can easily be viewed with this data-driven dashboard. All the charts and graphs used in this dashboard can be edited as per your data requirements as they are Excel linked, thus making them highly adaptable.
Download Procurement KPI Dashboard Total Spend Analysis PPT Samples
Human Resources KPI Dashboard Template 25
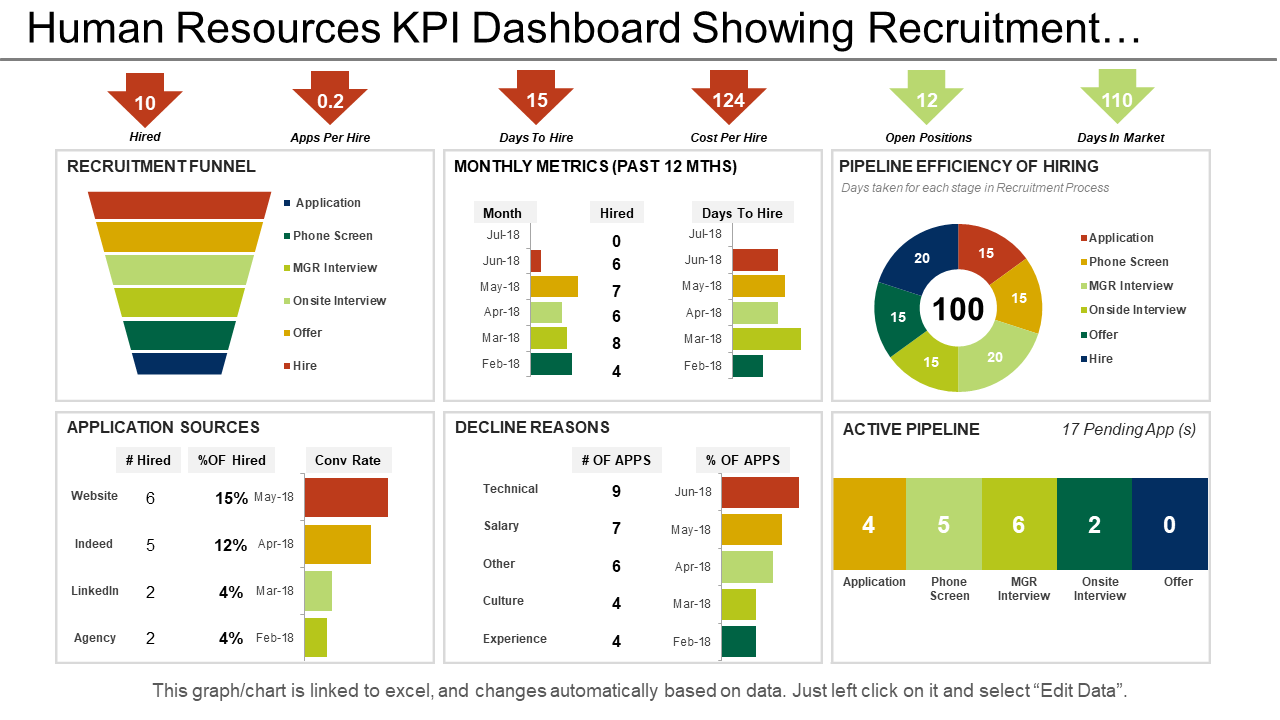
This is an advanced analytics tool that can be used to display important HR metrics like recruitment funnel, active pipeline, allocation sources, and many others. It provides an at-a-glance view of the important metrics to the HR department, thus helping them improve the recruiting process, optimize their work, and enhance the overall well-being and performance of the employees. With so many data visualizations that are Excel linked, this template can be adopted by any user as per his needs and requirements.
Download Human Resources KPI Dashboard Showing Recruitment Funnel Application Sources
Project Status KPI Dashboard Template 26
Project managers rarely have time to go through multiple spreadsheets to understand how well the project is progressing. The objective of this project status dashboard template is to quickly summarize various aspects of the project’s health such as task status, pending projects, completed products, etc. so that important facts can be presented at a glance. It presents a scannable view of the project, that can be used by any departmental head as per his needs and requirements. The data-driven quality of this template makes it a highly resourceful one to be used for viewing the success and failure of your projects.
Download Project Status KPI Dashboard Showing Project Timeline And Budget
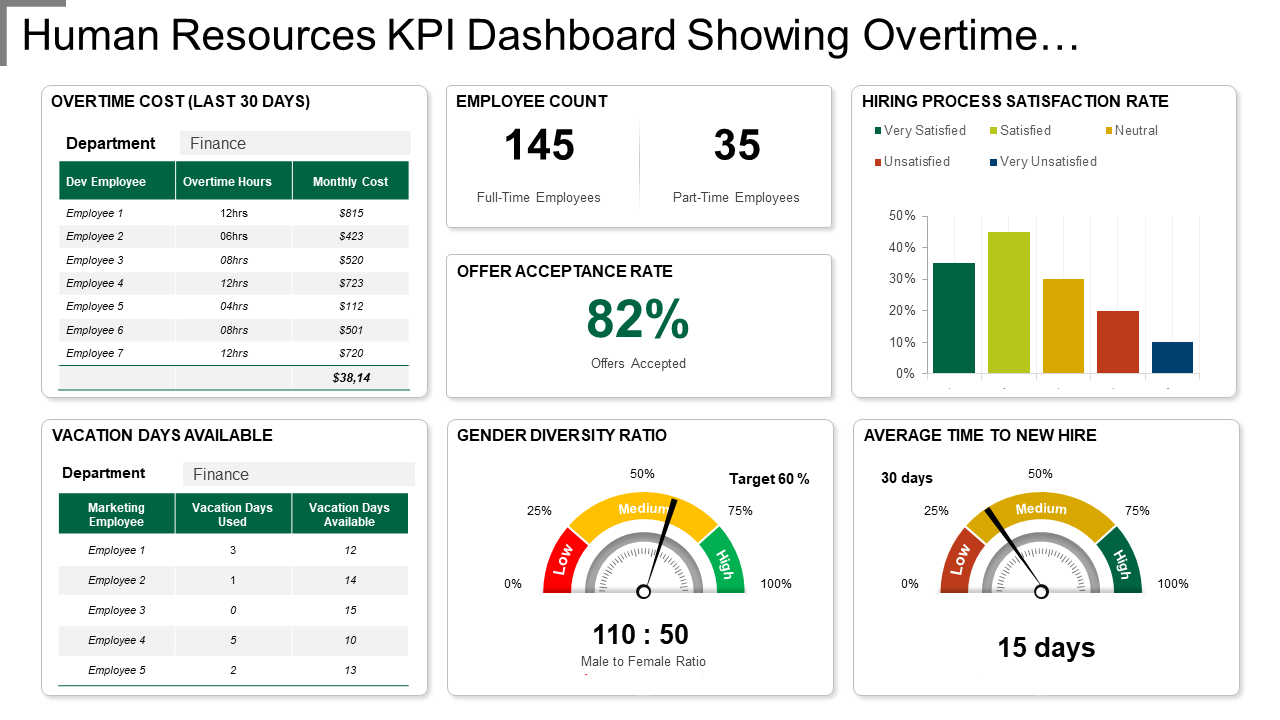
KPI Dashboard Template 27
Human Resources is one of the key fundamentals of running a company successfully. This template provides a snapshot of HR metrics such as gender diversity, the average time for new hire, vacation days, and others. Use it to report the important KPIs to executives, managers, and others. Further, it can be used to make viable HR strategies that will prove beneficial for the company as well as employees.
Download KPI Dashboard Showing Overtime Cost Gender Diversity Ratio
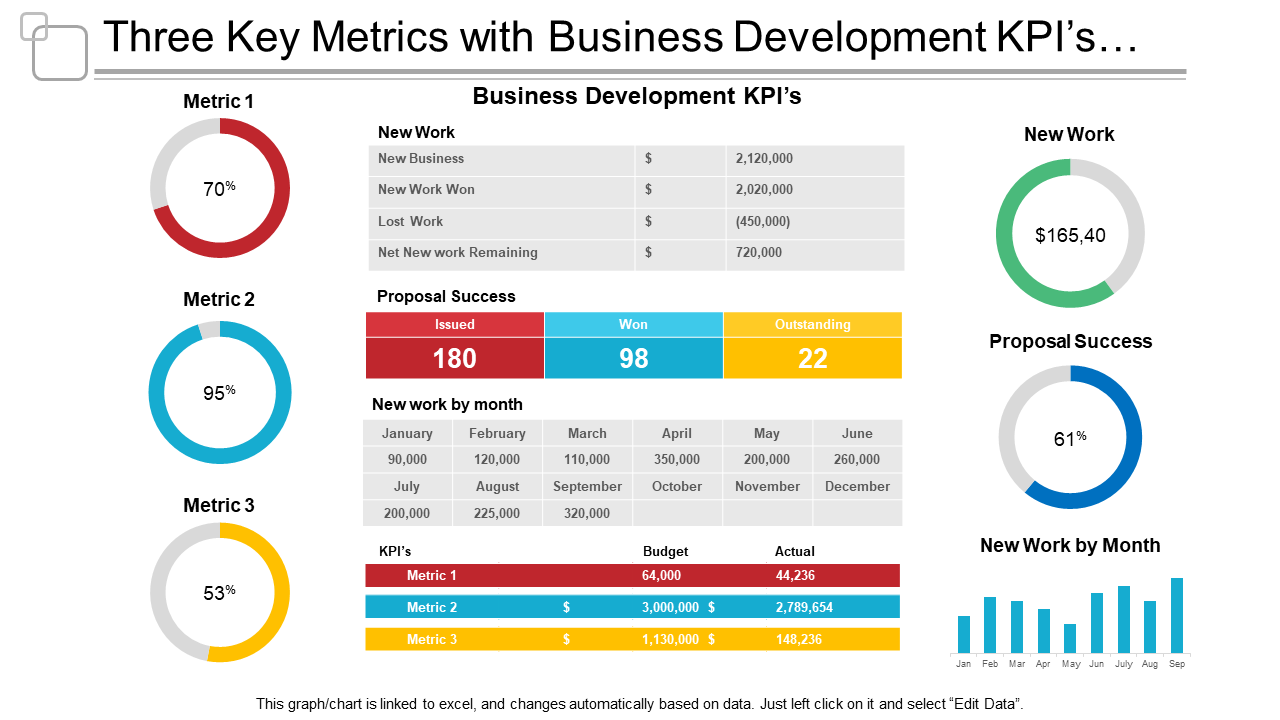
Three Key Metrics With Business Development KPIs Template 28
Employ this reporting tool to display a summary of business development KPIs and metrics like lost work, new business, amongst others. This dashboard helps in condensing large amounts of data into a single visual representation, thus making it far more comprehensible. Also, its data-driven feature makes it easily adaptable and versatile for any user.
Download Three Key Metrics With Business Development KPIs And Proposal Success
Risk Management KPI Dashboard Template 29
Determine and mitigate risks from various verticals with this dashboard template. Use it to examine various adverse conditions and unforeseen events that may lead to various risks. Since the topic of risk mitigation is very diverse, this dashboard template can be used to provide at a glance view of risk analysis, its identification, mitigation strategies, and others with various data-driven charts and graphs. This will surely save your time in creating a dashboard from the very scratch.
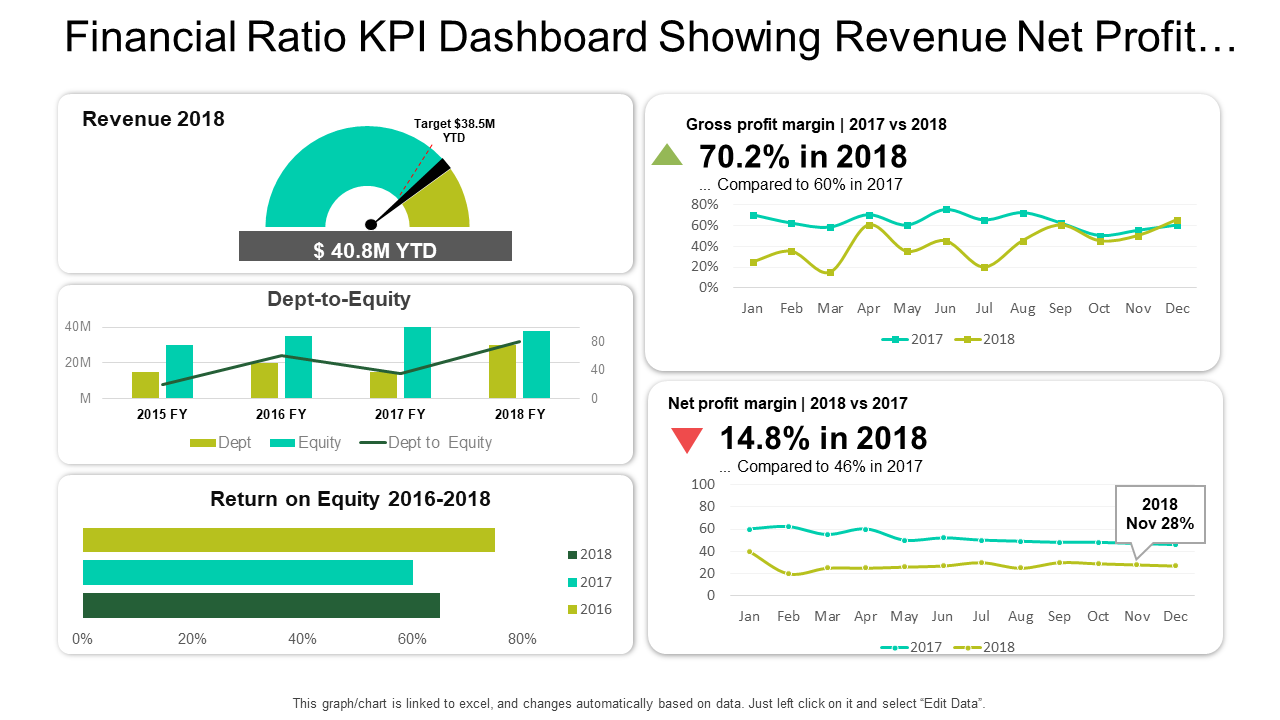
Financial Ratio KPI Dashboard Template 30
This financial ratio dashboard provides an instant visual representation of the company’s financial health. The finance department can use this layout to track the company’s expenses, profit, loss, revenue, return on equity, etc. in real-time. This helps in identifying the areas that require immediate attention to improve the financial condition of the organization. This template will also help in saving the time and resources of the company as everything is pre-designed and data-driven. All you have to do is download the template, add your data and see the charts getting automatically updated.
Download Financial Ratio KPI Dashboard Showing Revenue Net Profit Margin And Debt To Equity
These are our top 30 data-driven charts and graphs and we hope you found them inspiring enough to create your own designs.
Drop your thoughts in the comment section below and download these designs for further motivation!


 Customer Reviews














![[Updated 2023] 30 Best Gantt Chart PowerPoint Templates For an Effective Visualization of Your Project](https://www.slideteam.net/wp/wp-content/uploads/2020/05/Banner-1-335x146.png)


