


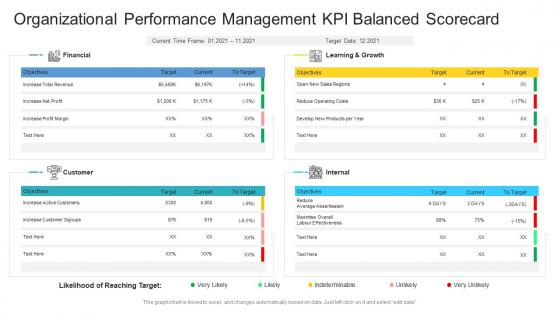
Organizational Performance Management KPI Balanced Scorecard




Try Before you Buy Download Free Sample Product
 Impress Your
 Audience
 100%
100% Editable
 Save Hours
 of Time


Our Organizational Performance Management KPI Balanced Scorecard are topically designed to provide an attractive backdrop to any subject. Use them to look like a presentation pro.
People who downloaded this PowerPoint presentation also viewed the following :
Organizational Performance Management KPI Balanced Scorecard with all 2 slides:
Use our Organizational Performance Management KPI Balanced Scorecard to effectively help you save your valuable time. They are readymade to fit into any presentation structure.

FAQs for Organizational Performance Management
Track conversion rates at each stage - that's your bread and butter. Revenue per rep and quota attainment are obvious but you gotta know them. I'd also watch deal size, sales cycle length, and how fast they respond to leads. The number of touches per deal tells you a lot too, honestly more than people think. Customer acquisition cost matters if you're trying to scale. Pick maybe 4-5 metrics max and review weekly with your team. Too many numbers and everyone's eyes glaze over.
Honestly, most companies totally screw this up by measuring stuff that's easy instead of useful. Start with what you're actually trying to accomplish, then figure out which numbers tell you if you're getting there. Like, don't get obsessed with website traffic if nobody's buying anything - conversion rates matter way more. Each metric should tie back to something that actually moves the needle for your business. Get your department heads involved so they can map their team's stuff to the bigger picture. That way everyone gets why they're tracking what they're tracking. Oh, and definitely review these quarterly because things change fast.
Match your KPIs to what you're actually trying to do - brand awareness means tracking reach, not conversions. Keep it to 3-5 metrics tops. More than that and you'll drown in data (learned this the hard way). Make sure you can actually measure what you pick with your current tools. Mix leading indicators like email opens with lagging ones like sales so you can pivot if things go sideways. The whole point is choosing metrics that actually tell you something useful about whether your campaign's working or totally bombing.
You'll want to track stuff like Net Promoter Score and churn rates - those tell you when customers are getting fed up. Response times matter too, plus what people are saying on social media (which honestly can be brutal but super telling). The key thing? Don't just collect all this data and let it sit there. Set up alerts when your scores tank and make sure someone's actually looking at dashboards regularly. Oh, and tie each metric to something you can actually fix - otherwise you're just drowning in numbers for no reason.
Dude, you really need KPIs - they're like having a dashboard while driving instead of just hoping for the best. Projects go off the rails when nobody's tracking the right stuff. I learned this the hard way on a project that seemed fine until suddenly it wasn't. Set up maybe 3-5 metrics that actually matter (not just busy work numbers) and check them weekly. They'll catch problems early before they turn into total disasters. Plus stakeholders love seeing concrete progress - keeps everyone happy and aligned. Trust me, it's way better than scrambling to explain what went wrong after everything's already blown up.
Honestly, you gotta stay on top of reviewing those KPIs against what's actually happening in the market. When things shift big time, don't be stubborn about keeping the same targets - I've watched teams burn out chasing numbers that just weren't realistic anymore. Market tanked? Maybe switch to tracking market share instead of pure growth. Quarterly check-ins work well for figuring out if your metrics still make sense. Sometimes you need to pivot completely, and that's totally fine. Just don't lose sight of your main business goals while you're adjusting everything else.
So basically, lagging KPIs track stuff that already went down - revenue, how many customers bailed, that kind of thing. Leading ones predict what's coming, like your sales pipeline or web traffic. Picture driving: lagging = checking your rearview mirror, leading = actually watching where you're going. Pretty obvious which one's more helpful, right? You need lagging metrics to show stakeholders how things turned out. But leading indicators? Those are gold for daily management since you can fix problems before they tank your numbers. Most companies use both, though I'm personally way more obsessed with the leading stuff. Figure out which early signals actually connect to your big goals first.
Dude, visual dashboards are a total game-changer for tracking KPIs. Instead of staring at endless spreadsheet rows, you'll spot trends and weird outliers instantly. Real-time charts let you catch problems early before they blow up. Plus, when you're presenting to executives or other stakeholders, they eat up good visuals way more than boring data tables. I mean, nobody wants to squint at numbers all day, right? Interactive dashboards are amazing once you get the hang of it. My advice? Start with simple bar charts and line graphs first, then work up to the fancy stuff.
Quarterly reviews are probably your best bet, though it really depends on how crazy your industry gets. I'd set up regular check-ins to ask: do these KPIs still match what we're actually trying to accomplish? Are they pushing people toward the right stuff? You'll be surprised how often a metric that seemed brilliant six months ago is now steering everyone the wrong way. Markets shift, budgets change, priorities get flipped upside down - so your targets need to shift too. Honestly, treat them like living things that need attention, not some spreadsheet you can ignore.
Hey! So the big thing is making sure your KPIs don't accidentally screw people over. Call centers are the worst example - if you only measure how fast reps handle calls, they'll just hang up on customers basically. Pick metrics that actually match what you care about. Privacy stuff matters too when you're collecting data. Your team needs to know what they're being measured on and why, otherwise it's just confusing for everyone. I always think the best KPIs push people toward good behavior instead of gaming the system. Does that help?
Honestly, automation is a game-changer for KPI tracking. Instead of copying data between spreadsheets all day (ugh), you can set up dashboards that pull everything automatically. Tools like Tableau or Power BI work great for this. Real-time updates mean you'll actually catch problems early instead of finding out about them weeks later. The alerts are clutch too - they'll ping you when numbers hit certain levels. I'd start by listing what data you check manually every day. That's probably where you'll save the most time.
Just stick to 2-3 metrics that actually matter for your business stage. CAC, MRR (or active users), and CLV are usually your best bets early on. Seriously, don't get sucked into tracking total signups or other feel-good numbers - they're basically useless for making real decisions. You want metrics that tell you where to spend your money and time, not ones that just look impressive on a dashboard. Keep it simple at first and track them consistently. You can always add more complicated stuff later when you've got the basics down and you're growing.
Honestly, start with eNPS - just ask if they'd recommend working there. Turnover rates tell you tons, especially when people quit voluntarily. I'd skip those awful annual surveys and do quick pulse checks instead. Way better response rates. Absenteeism is another big red flag to watch. Also track who's actually showing up to company events and whether you're promoting from within. Time-to-fill positions matters too - good teams don't want to leave. The numbers are helpful, but you really need those regular one-on-ones to see what's actually going on.
Honestly, a good KPI setup can bump your productivity by like 15-25% because everyone finally knows what they're actually supposed to be doing. No more spinning wheels on random stuff. Your team starts focusing on what moves the needle instead of just looking busy - which, let's be real, happens way too often. You'll catch problems early too since you can actually see where things are breaking down. Oh, and it gets everyone pulling in the same direction for once. Pick maybe 3-5 KPIs that connect to your main goals and actually stick to tracking them. That's where most people mess up.
Ugh, misaligned KPIs are the worst - they basically trick everyone into chasing the wrong goals. Your customer service team gets measured on call speed? They'll rush people off the phone instead of actually helping. Meanwhile leadership thinks everything's perfect because the dashboard looks green. Then you're making big decisions based on completely misleading data. I've seen this mess up so many companies, honestly. The solution is pretty straightforward though - audit your KPIs regularly to make sure they're driving the right behaviors, not just measuring whatever's easiest to track.
-
Much better than the original! Thanks for the quick turnaround.
-
Professional and unique presentations.