


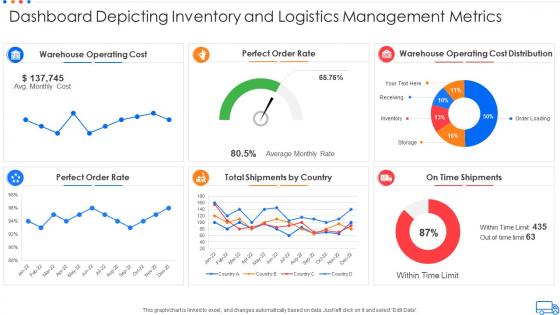
Dashboard depicting inventory and logistics management metrics




Try Before you Buy Download Free Sample Product
 Impress Your
 Audience
 100%
100% Editable
 Save Hours
 of Time


Our Dashboard Depicting Inventory And Logistics Management Metrics are topically designed to provide an attractive backdrop to any subject. Use them to look like a presentation pro.
People who downloaded this PowerPoint presentation also viewed the following :
Dashboard depicting inventory and logistics management metrics with all 7 slides:
Use our Dashboard Depicting Inventory And Logistics Management Metrics to effectively help you save your valuable time. They are readymade to fit into any presentation structure.





FAQs for Dashboard depicting inventory and
Essential KPIs for inventory and logistics dashboards include inventory turnover rates, stock-out frequency, order fulfillment times, carrying costs, and supplier performance metrics. These indicators enable organizations to streamline operations by identifying bottlenecks, optimizing stock levels, and enhancing delivery performance, with many retail and manufacturing companies finding that comprehensive KPI tracking ultimately delivers reduced costs and improved customer satisfaction.
Data visualization improves inventory decision-making by transforming complex data into clear, actionable insights through real-time dashboards, trend analysis, and predictive analytics. These visual tools enable managers to quickly identify stock patterns, optimize reorder points, and reduce carrying costs, with many retail and manufacturing organizations finding that visual dashboards accelerate decision speed while minimizing stockouts and excess inventory.
Real-time tracking in logistics dashboards delivers enhanced visibility, improved decision-making, proactive issue resolution, reduced operational costs, and increased customer satisfaction. Through automated monitoring and instant alerts, companies streamline supply chain operations, minimize delays, and optimize resource allocation, with many retail and manufacturing organizations finding that real-time insights ultimately provide significant competitive advantages.
Integrating supply chain data into inventory dashboards involves connecting ERP systems, warehouse management platforms, supplier portals, transportation networks, and real-time tracking technologies through APIs and data connectors. This integration enables organizations to streamline inventory visibility, automate reorder processes, and optimize stock levels across multiple locations, with many manufacturing and retail companies finding that consolidated data ultimately delivers faster decision-making and reduced operational costs.
Tools for creating effective inventory and logistics dashboards include Tableau, Power BI, QlikView, Looker, and specialized platforms like Oracle NetSuite and SAP Analytics Cloud. These solutions streamline operations by providing real-time visibility into stock levels, shipment tracking, and supply chain performance, with many retailers and manufacturers finding that integrated dashboards reduce inventory costs while enhancing delivery accuracy and customer satisfaction.
Dashboards help identify supply chain bottlenecks by providing real-time visibility into inventory levels, shipment delays, supplier performance metrics, and demand fluctuations across all operational touchpoints. Through automated alerts and predictive analytics, organizations can quickly pinpoint disruptions in manufacturing, warehousing, or distribution networks, enabling proactive interventions that minimize delays and optimize resource allocation.
Predictive analytics enhances inventory and logistics by forecasting demand patterns, identifying potential supply chain disruptions, and optimizing stock levels across multiple locations. Through machine learning algorithms, retailers and manufacturers can reduce carrying costs, minimize stockouts, and improve delivery times, with many organizations finding that these insights enable proactive decision-making and significant operational efficiency gains.
An inventory and logistics dashboard enhances customer satisfaction by providing real-time visibility into stock levels, shipment tracking, and delivery timelines, enabling proactive communication and accurate delivery promises. Through automated alerts and predictive analytics, businesses streamline order fulfillment, minimize stockouts, and reduce delivery delays, ultimately delivering faster services and more reliable customer experiences.
Organizations face challenges including data integration from disparate systems, real-time synchronization across multiple locations, user adoption resistance, and ensuring data accuracy while maintaining system scalability. These implementation hurdles often require significant change management and technical expertise, with many companies finding that phased rollouts and comprehensive training programs ultimately deliver smoother transitions and higher operational efficiency.
Inventory turnover rate directly influences dashboard metrics by determining stock velocity calculations, reorder timing alerts, and cash flow projections displayed in real-time visualizations. Higher turnover rates trigger more frequent inventory updates, automated procurement recommendations, and performance benchmarks, while lower rates highlight slow-moving stock and storage cost implications, ultimately enabling managers to optimize inventory levels and improve operational efficiency across their supply chain operations.
Best practices for designing user-friendly inventory dashboards include prioritizing real-time data visibility, implementing intuitive navigation with customizable widgets, using clear visual hierarchies with color-coded alerts, and ensuring mobile responsiveness across devices. These design principles streamline decision-making by reducing cognitive load, enhancing operational efficiency, and enabling faster inventory responses, with many retail and manufacturing organizations finding that well-designed dashboards significantly improve stock management accuracy and reduce operational costs.
Inventory data should be updated in real-time or near real-time on logistics dashboards, with most organizations refreshing data every 15-30 minutes depending on operational complexity and system capabilities. Through automated integration with warehouse management systems and point-of-sale platforms, companies achieve continuous visibility into stock levels, shipment statuses, and demand fluctuations, ultimately enabling faster decision-making and reducing costly stockouts or overstock situations.
Logistics dashboards should prioritize real-time shipment tracking, inventory levels, delivery performance metrics, transportation costs, and supplier performance indicators. These elements enable organizations to streamline operations by identifying bottlenecks, optimizing routes, and managing stock efficiently, with many logistics companies finding that enhanced visibility ultimately delivers faster deliveries and reduced operational costs.
Mobile access to inventory management dashboards enables real-time monitoring, instant decision-making, and streamlined workflows by providing updates on stock levels, shipments, and alerts from anywhere. Warehouse managers and field teams can quickly respond to inventory shortages, track deliveries, and coordinate with suppliers while on-site, ultimately reducing delays and enhancing operational efficiency across distributed facilities.
Inaccurate data significantly undermines inventory and logistics performance tracking by creating misleading KPIs, incorrect demand forecasts, inefficient resource allocation, and poor decision-making across supply chain operations. These data quality issues ultimately lead to increased costs, stockouts, excess inventory, and compromised customer satisfaction, with many organizations finding that data accuracy directly correlates with operational efficiency and competitive advantage.
-
Nice and innovative design.
-
Presentation Design is very nice, good work with the content as well.