


Project Management Dashboard PowerPoint PPT Template Bundles




Try Before you Buy Download Free Sample Product
 Impress Your
 Audience
 100%
100% Editable
 Save Hours
 of Time


Our Project Management Dashboard PowerPoint PPT Template Bundles are topically designed to provide an attractive backdrop to any subject. Use them to look like a presentation pro.
People who downloaded this PowerPoint presentation also viewed the following :
Project Management Dashboard PowerPoint PPT Template Bundles with all 68 slides:
Use our Project Management Dashboard PowerPoint PPT Template Bundles to effectively help you save your valuable time. They are readymade to fit into any presentation structure.

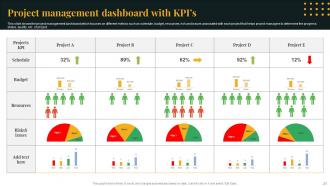
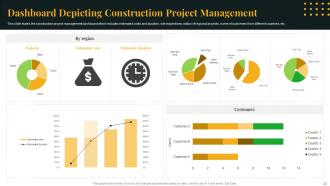
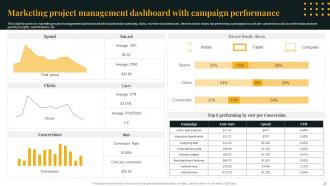
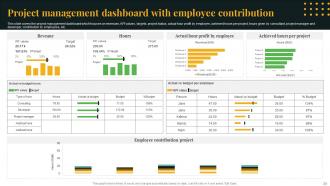






FAQs for Project Management Dashboard PowerPoint
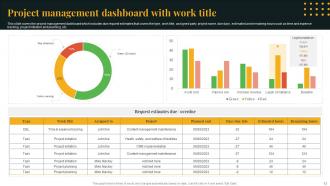
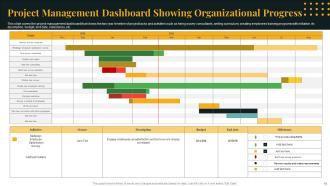
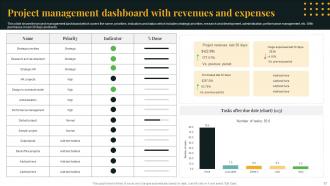
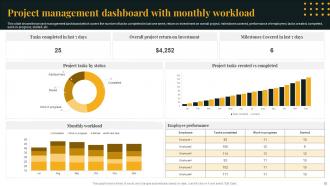
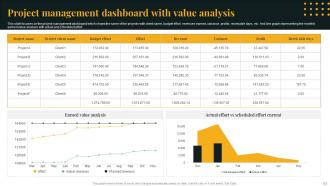
Essential components of an effective Project Management Dashboard include project timeline tracking, resource allocation monitors, budget status indicators, milestone progress charts, and risk assessment tools. These elements streamline project oversight by centralizing critical data, enhancing team communication, and enabling proactive decision-making, with many organizations finding that comprehensive dashboards ultimately deliver improved project completion rates and strategic resource optimization.
A dashboard improves stakeholder communication by providing real-time visibility into project status, milestones, and performance metrics through centralized reporting. This transparency enables faster decision-making, reduces email chains, and ensures all stakeholders access consistent information, with many project teams finding that shared dashboards minimize miscommunication and enhance collaborative efficiency across departments.
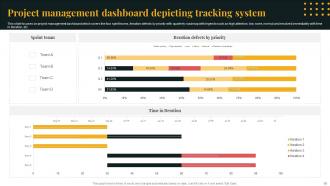
Agile project management dashboards should prioritize sprint velocity, burndown charts, cycle time, defect rates, and team capacity utilization as core metrics. These indicators enable project managers to track delivery pace, identify bottlenecks, and optimize resource allocation, with many software development teams finding that real-time visibility into these metrics accelerates delivery timelines and enhances overall project outcomes.
Data visualization enhances project performance tracking by transforming complex metrics into clear charts, graphs, and visual indicators that reveal trends, bottlenecks, and progress patterns instantly. Through interactive dashboards, project managers can identify risks earlier, communicate status more effectively to stakeholders, and make data-driven decisions faster, ultimately delivering improved project outcomes and enhanced team accountability.
Tools for creating customizable Project Management Dashboards include Microsoft Project, Asana, Trello, Monday.com, Smartsheet, and Tableau, offering flexible visualization and tracking capabilities. These platforms streamline project oversight by enabling real-time progress monitoring, resource allocation tracking, and stakeholder communication, with many organizations finding that customizable dashboards enhance decision-making speed and ultimately deliver improved project outcomes across teams.
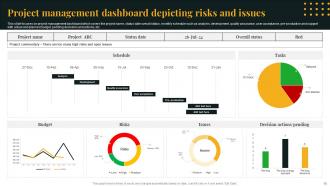
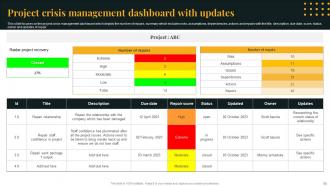
A project management dashboard facilitates risk management by providing real-time risk tracking, automated alert systems, visual risk matrices, and predictive analytics capabilities. Through centralized monitoring, project managers can identify potential issues early, assess impact probabilities, and implement mitigation strategies proactively, with many organizations finding that dashboard-driven risk management reduces project delays and cost overruns significantly.
Real-time data integration enhances project decision-making by providing instant visibility into project status, resource allocation, budget utilization, and performance metrics across all project phases. With immediate access to current information, project managers can identify bottlenecks, adjust timelines, and reallocate resources proactively, ultimately reducing delays and improving project outcomes.
Best practices for maintaining an updated Project Management Dashboard include establishing automated data feeds, implementing real-time tracking systems, scheduling regular review cycles, assigning clear ownership responsibilities, and creating standardized update protocols. These practices streamline project oversight by minimizing manual errors, enhancing visibility across teams, and enabling faster decision-making, with many organizations finding that consistent dashboard maintenance ultimately delivers improved project outcomes and operational efficiency.
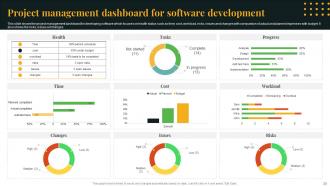
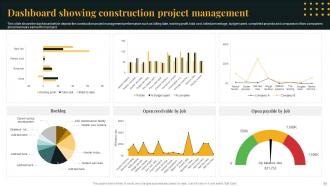
Project management dashboards can be tailored through customizable KPIs, industry-specific templates, role-based access controls, and flexible reporting structures that align with sector requirements. Construction projects might emphasize resource allocation and timeline tracking, while software development focuses on sprint progress and bug resolution, ultimately delivering enhanced visibility and operational efficiency across diverse organizational needs.
User feedback drives dashboard optimization by identifying pain points, revealing workflow inefficiencies, highlighting missing features, and uncovering navigation challenges that designers may overlook. Through surveys, user testing sessions, and analytics review, project teams can streamline interfaces, enhance data visualization clarity, and add functionality that truly supports decision-making, ultimately delivering dashboards that increase user adoption and improve project outcomes.
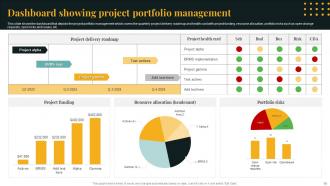
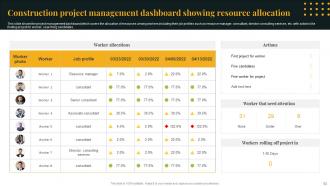
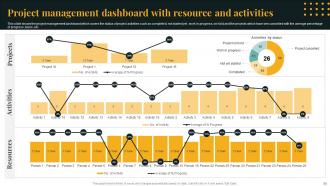
A Project Management Dashboard helps in resource allocation by providing real-time visibility into team workloads, project timelines, and capacity constraints across all active initiatives. Through centralized tracking and analytics, organizations can identify overallocated team members, redistribute tasks strategically, and optimize productivity, while minimizing bottlenecks and ultimately delivering projects more efficiently and cost-effectively.
Common pitfalls include overloading dashboards with excessive metrics, neglecting user-specific customization needs, poor visual hierarchy that obscures critical information, and failing to integrate real-time data sources effectively. These design challenges often result in reduced user adoption, delayed decision-making, and missed project milestones, with many organizations finding that streamlined, role-based dashboards ultimately deliver better project visibility and team performance.
Measuring ROI involves comparing dashboard implementation costs against quantifiable benefits like reduced project delivery times, decreased resource waste, improved team productivity, and enhanced client satisfaction rates. Many organizations track metrics such as project completion speed increases, cost overruns reduction, and improved resource utilization, with companies typically finding 15-30% efficiency gains that significantly outweigh initial investment costs.
Collaborative dashboards enhance team morale and productivity by providing transparent progress visibility, enabling real-time communication, and fostering shared accountability across all project stakeholders. Through centralized data access, teams experience reduced miscommunication, faster decision-making, and increased engagement, with many organizations finding that enhanced transparency ultimately delivers stronger team cohesion and measurable productivity gains.
Project managers can effectively train teams through hands-on workshops, role-specific tutorials, and gradual implementation phases that demonstrate dashboard functionality with real project data. Starting with core features like task tracking and progress visualization, then expanding to advanced analytics, helps teams build confidence while experiencing immediate benefits in project visibility, accountability, and decision-making efficiency.
-
My search for complete decks ended with SlideTeam. Such a surplus collection of HD PowerPoints. Moreover, their standard and widescreen formats have helped me in delivering bullseye presentations.
-
The information is visually stunning and easy to understand, making it perfect for any business person. So I would highly recommend you purchase this PPT design now!