


Devops dashboard it powerpoint presentation slides


Try Before you Buy Download Free Sample Product
 Impress Your
 Audience
Editable
of Time


The DevOps dashboard ensures a stable experience for end users and allows system developers to stay up to date. Check out our competently designed DevOps Dashboard IT template that covers dashboard collection, including key routine metrics. The proposal allows users to track the effectiveness of the development and delivery processes in DevOps metrics. These dashboard templates cover data across tools, monitor insights, track issues, and enable faster feedback cycles. These DevOps dashboards are a reporting tool that aggregates metrics from multiple devices to create a monitoring interface for software development teams. DevOps dashboards track metrics, including uptime, downtime, response times, load times, bugs, development work items, and more. This template also includes dashboards for sprint management covering planned vs. completed work items, active bugs by severity. In addition, it covers the key performance indicators of the DevOps evaluation, such as activity per application, storefront users, revenue per hour, etc. These templates also include DevOps performance evaluation KPI metrics such as faster and longer time to time with faster and lower stability times. Lastly, this proposal covers the DevOps Website Review Dashboard, including Application Upstreaming KPIs and the Summer Addendum. Download our 100% editable and customizable template and access it now.
People who downloaded this PowerPoint presentation also viewed the following :
Content of this Powerpoint Presentation
Slide 1: This slide displays title i.e. 'DevOps Dashboard (IT)' and your Company Name.
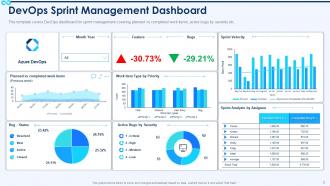
Slide 2: This slide presents 'DevOps Sprint Management Dashboard'.
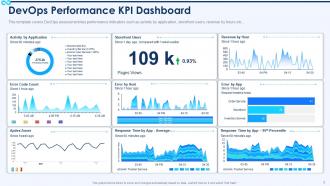
Slide 3: This slide exhibits 'DevOps Performance KPI Dashboard'.
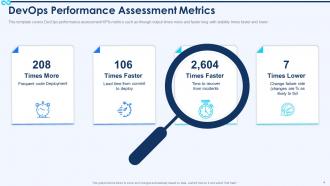
Slide 4: This slide covers DevOps assessment key performance indicators such as activity by application, storefront users, etc.
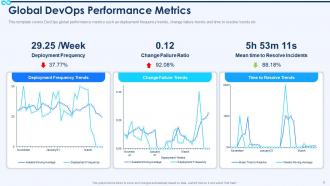
Slide 5: This slide covers DevOps global performance metrics such as deployment frequency trends, etc.
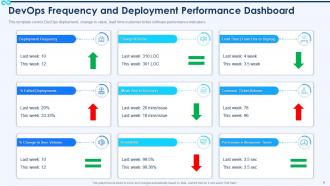
Slide 6: This slide depicts 'DevOps Frequency and Deployment Performance Dashboard'.
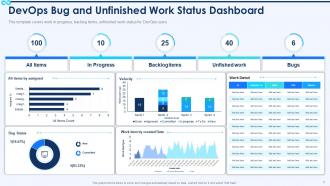
Slide 7: This slide covers work in progress, backlog items, unfinished work status for DevOps users.
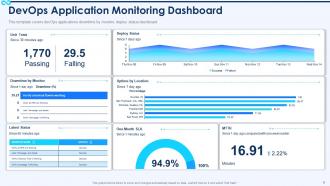
Slide 8: This slide covers DevOps applications monitoring dashboard.
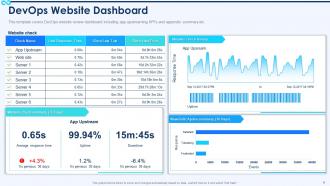
Slide 9: This slide depicts 'DevOps Website Dashboard'.
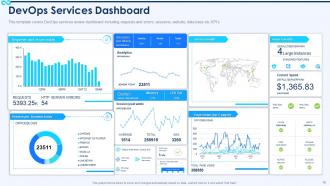
Slide 10: This slide highlights 'DevOps Services Dashboard'.
Slide 11: This is the icons slide.
Slide 12: This slide presents title for additional slides.
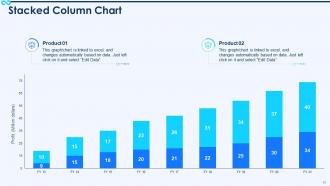
Slide 13: This slide exhibits yearly profits stacked column charts for different products. The charts are linked to Excel.
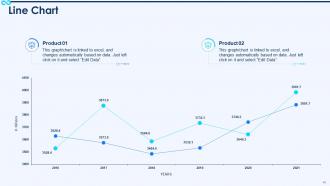
Slide 14: This slide displays yearly line charts for different products. The charts are linked to Excel.
Slide 15: This slide displays puzzle.
Slide 16: This slide depicts posts for past experiences of clients.
Slide 17: This slide presents circular diagram.
Slide 18: This slide displays magnifying glass.
Slide 19: This slide exhibits ideas generated.
Slide 20: This slide displays Venn.
Slide 21: This slide exhibits yearly timeline.
Slide 22: This is thank you slide & contains contact details of company like office address, phone no., etc.
Devops dashboard it powerpoint presentation slides with all 22 slides:
Use our DevOps Dashboard IT Powerpoint Presentation Slides to effectively help you save your valuable time. They are readymade to fit into any presentation structure.


FAQs for Devops dashboard it
Focus on deployment stuff first - how often you're shipping, lead times, failure rates. Then track system health like uptime and performance. Your CI/CD pipeline status matters too, plus team productivity metrics. But honestly? Most dashboards I've seen are total garbage because they try cramming everything in. Keep it simple with clean charts and real-time data everyone can read quickly. The whole point is answering "are we delivering value without breaking things?" Start there, then add whatever else your team actually uses to make decisions.
So basically it's like having one screen where you can see everything that's going on - builds, deployments, when stuff breaks, all that. No more digging through five different tools or slacking people "wait is this live yet?" Real-time updates so you actually know what's happening. Teams catch problems way faster, and honestly it stops those awkward moments when everyone thinks someone else deployed something. I'd start small though - just throw your main metrics up there first. People need to get in the habit of actually looking at it before you go crazy adding widgets everywhere.
Start with the DORA metrics - they're gold for this stuff. Deployment frequency and lead time show how fast you're shipping. Change failure rate and mean time to recovery tell you if your releases actually work. Honestly? Don't go overboard adding every metric you can think of. Just creates clutter and nobody looks at it anyway. Your dashboard should tell the pipeline story in like 5 seconds. Pick 2-3 business metrics your stakeholders actually care about, then stop there. The whole point is making it actionable, not impressive-looking.
Set your data pipelines to sync every 30-60 seconds - honestly depends on how much your system can handle without choking. Pull straight from the main sources like CI/CD tools and monitoring systems, not some secondary database that's always behind. Nothing worse than your dashboard showing everything's fine while stuff's actually burning down. Oh and definitely add validation checks - you don't want stale data sneaking in. Set up alerts if sources go dark. I'd start by checking where you're getting data now and figuring out what's causing the delays.
Grafana's probably your best bet - it's crazy flexible and connects to basically everything. I've been using it for years and still find new ways to customize stuff. For logs, Kibana's solid. Datadog and New Relic are good if you want something that works right out of the box without much setup. The Prometheus + Grafana combo is pretty common too, though maybe overkill depending on your needs. Honestly? Figure out what metrics you actually care about first. Half the dashboards I see are just metric soup that nobody looks at. Then pick whatever tool makes those specific things easiest to see.
Look, a good DevOps dashboard basically shows you where everything's getting stuck in real time. Code reviews taking forever? Tests constantly breaking? You'll see it all laid out visually - sometimes it's honestly brutal how obvious the problems become. But that's the point, right? No more wild guessing about why your deployments are dragging. The data tells you exactly which stage is screwing things up. Oh, and definitely set up alerts for your main metrics. Trust me, catching issues early beats scrambling when your whole sprint goes sideways.
Honestly, automation is what makes your DevOps dashboard actually worth looking at instead of being total eye candy. Without it, you're manually updating everything like some kind of cave person. Set up those API connections first - they'll pull in build statuses, test results, deployment stuff, all the performance data automatically. Real-time feeds from your CI/CD tools and monitoring systems keep everything current. Nobody has time to babysit dashboards these days. Once you get those data pipelines running, you can actually trust what you're seeing on screen.
Each group wants different stuff, you know? Devs care about deployment frequency, build success rates, recovery time - the technical metrics they can fix. Meanwhile, managers are focused on sprint velocity and team productivity. Executives just want the big picture: uptime, customer satisfaction, ROI. It's honestly like they speak completely different languages sometimes. Set up role-based dashboards so people only see what's relevant to them - cuts through all the clutter. Oh, and ask each person what decisions they're making every day. That'll tell you exactly which metrics matter most to them.
Track the stuff that actually matters - how often you're deploying, lead times, failure rates, recovery time. Make it visual with red/yellow/green so you don't have to think too hard. I swear, some teams build these insane dashboards that look impressive but tell you absolutely nothing. Real-time updates are clutch. Put your biggest problems right at the top where you can't miss them. Here's the test: grab someone random and see if they can figure out what's broken just by glancing at it. If they can't, you've overcomplicated things.
Look, a good DevOps dashboard is like having eyes on everything at once. Instead of frantically clicking between fifteen different tools, you get all your metrics, logs, and alerts in one spot. Real-time visibility means catching problems before they blow up in your face. Track response times, spot patterns, see who's working on what during incidents. Set up alerts that actually mean something – not just random noise that'll drive you crazy. Honestly, I'd start with your most critical services first. You can get fancy with the rest later once you've got the basics down.
Honestly, data integration is gonna be your worst nightmare. Jenkins, Jira, monitoring tools - none of them want to talk to each other properly. Most teams also go overboard with metrics at first (I swear some dashboards need their own instruction manual). Wrong KPIs are another trap - you'll track stuff that looks impressive but doesn't actually help anyone make decisions. Getting people to check it regularly is harder than you'd think too. My advice? Pick like 3-4 metrics everyone cares about first. Build from there once it's actually being used.
Honestly, just watch someone use your dashboard for the first time - you'll cringe at how confusing it actually is. Set up feedback sessions with different teams since devs and ops folks need totally different things. Surveys and user interviews help too, but nothing beats seeing someone struggle to find basic stuff in real time. Track your analytics to see where people actually click vs where you think they should. Oh, and don't try to fix everything at once - that's a nightmare. Focus on the quick wins first, like better layout or those shortcuts everyone keeps bugging you about. Prioritize based on what'll actually improve their daily grind.
Dude, first thing - audit what you're showing right now. API keys and database creds are obvious no-nos, but don't forget customer data or anything that screams "hack me please." Role-based access is clutch so people only see their stuff. Physical security matters too - who's walking past those office monitors? I learned this the hard way when our cleaning crew got an eyeful of sensitive metrics lol. Data masking works great for sensitive fields. Set up proper auth and review regularly. Honestly, most people expose way more than they realize on these dashboards.
So basically your DevOps dashboard becomes like the control center for everything. Instead of bouncing between Jenkins and GitLab and whatever else, you see all your build statuses and deployment stuff in one spot. Build fails? You'll know immediately. It tracks your deployment history and metrics too - lead times, how often you're pushing code, all that. Honestly saved my team so much headache last year. You can actually spot where things are getting stuck instead of playing detective across five different tools. Real-time visibility makes catching problems way easier before they blow up.
Honestly, a good DevOps dashboard is a game changer for getting your team on the same page. No more "hey, what's happening with that deployment?" messages every five minutes. Everyone can just look at the same real-time data and spot problems together. Your standups actually become useful since people aren't guessing about metrics anymore. The communication gaps between dev, ops, and QA basically disappear - which is huge if you've ever dealt with that mess before. Start with whatever questions your team asks most. That stuff should be right up front where everyone can see it.
-
Great quality product.
-
Great designs, really helpful.
-
Awesomely designed templates, Easy to understand.