Within the software/IT market, resourcefulness and efficiency separate the haves from the have-nots, the ones who made it big from the ones who tried hard but failed. A successful business in this domain would need to have their processes in exact order and impart structure to their product management flow.
In this blog, we’re going train our gaze on a potent, powerful new culture within the tech marketplace, one that aims to integrate and harmonise software development and IT – DevOps.
DevOps: Culture, philosophy or strategy
In today’s rapidly evolving marketplace, most people would consider ‘DevOps’ to be less of a business strategy and more of a ‘culture’, a philosophy that aims to drive a software company to its full potential for success and optimize its profit streams.
Prior to 2006, most companies had a software development team and an IT team, and the two departments were viewed as separate, self-contained entities within the bigger organizational mechanism. The DevOps philosophy turned this around completely, aiming to synchronize and merge these two branches into a single, cohesive system. Considering that this would be a fusion of two massive engines within a company’s wider machinery, there was little room for error and a much greater incentive for a business to be as organized and resourceful as possible.
DevOps and Dashboards
Creating products and managing your IT faculties are stressful enough, when tackled alone. Bringing these two dimensions of a business together could trigger a whole maelstrom of challenges and stress factors within the work sphere of any business. And DevOps aims to do just that. For anyone seeking to keep projects in order and hold enterprising exchanges within your teams, dashboards are a helpful tool. These are also a good monitoring tool. See how dashboards are such a good tool to monitor your business with SlideTeam’s comprehensive blog on the topic. Click here to access this best-in-class business monitoring mechanism.
In an otherwise colorless and grey corporate space, dashboards serve as a vibrant and engaging method of interaction. Using dashboards – such as the ones we’re about to lay out for you – is sure to elevate the experience for both managers and team members alike. In this blog, we are showcasing 10 DevOp dashboard templates that will help you scrutinize your internal processes and optimize efficiency in the workplace.
Let us explore this parallel universe of beautiful and effective dashboards. These are both elegant and practical.
Template 1: DevOps Dashboard IT PowerPoint Presentation Deck
If you’re seeking to give an information-rich presentation to an audience that simplifies and crunches down the intricacies of your DevOps processes, this PPT is the one you need. It comes with 22 slides, all of which can be subject to modifications and alterations, thereby aiding your needs at any given moment.
Through the breadth of the PPT Template, a host of vital parameters are laid bare for the audience, including, but not limited to, sprint velocity, work item by priority, active bugs by severity, sprint analysis by assignee, and more. Employ these metrics to get a complete picture of the processes in your teams.
Template 2: DevOps KPI Metrics Dashboard
Making a mark in the professional space is easier and more accessible with an aesthetically-done PPT such as this one. Consisting of twelve slides, it has powerful graphics and a series of analytical images that adhere to a cohesive structure. Some of the performance measures that this exhaustive PPT covers among its many slides include test case status, deflect status, test case status by resource, active bugs, revenue by hour, error code count, errors by application and many more. Scrutinize your performance metrics with this PPT, which delivers quality KPI visualization with the most savvy, professional touch.
Template 3: DevOps Dashboard for Quality Management Tracking
Quality management is crucial to advancing your business and making it to the top. This dashboard helps you disseminate critical information in this particular area, including static analysis, unit tests and code coverage. The average build duration and the build summary per day are also considered in the left hand side of the slide for a more rigorous assessment. The template can also be customized with modifications and alterations that suit you as per your need.
Template 4: DevOps +Sprint Management Dashboard
Software development is an inherently precise art, and with this dashboard, you get a chance to master just that. This dashboard lays out graphs for planned work vs completed work, as well as for active bugs by severity. This Azure DevOps dashboard slide enables managers to dissect the sprint velocity, the sprint analysis by assignee, and the work type by priority as well, making for a much more insightful data gathering within your team.
Template 5: DevOps Dashboard for Performance Assessment Metrics
Apart from being aesthetic in design and easy to edit and use, this dashboard allows you to scan four primary metrics in any project that you’re running. The first is the number of times more deployment of code takes place, allowing you to check the frequency of deployment. The second examines the number of times faster the passage to deployment takes place. The third watch the number of times faster recovery from incidents happens and the last scrutinizes the number of times lower the percentage of failure within the project is. Boost performance within your operations by downloading it now!
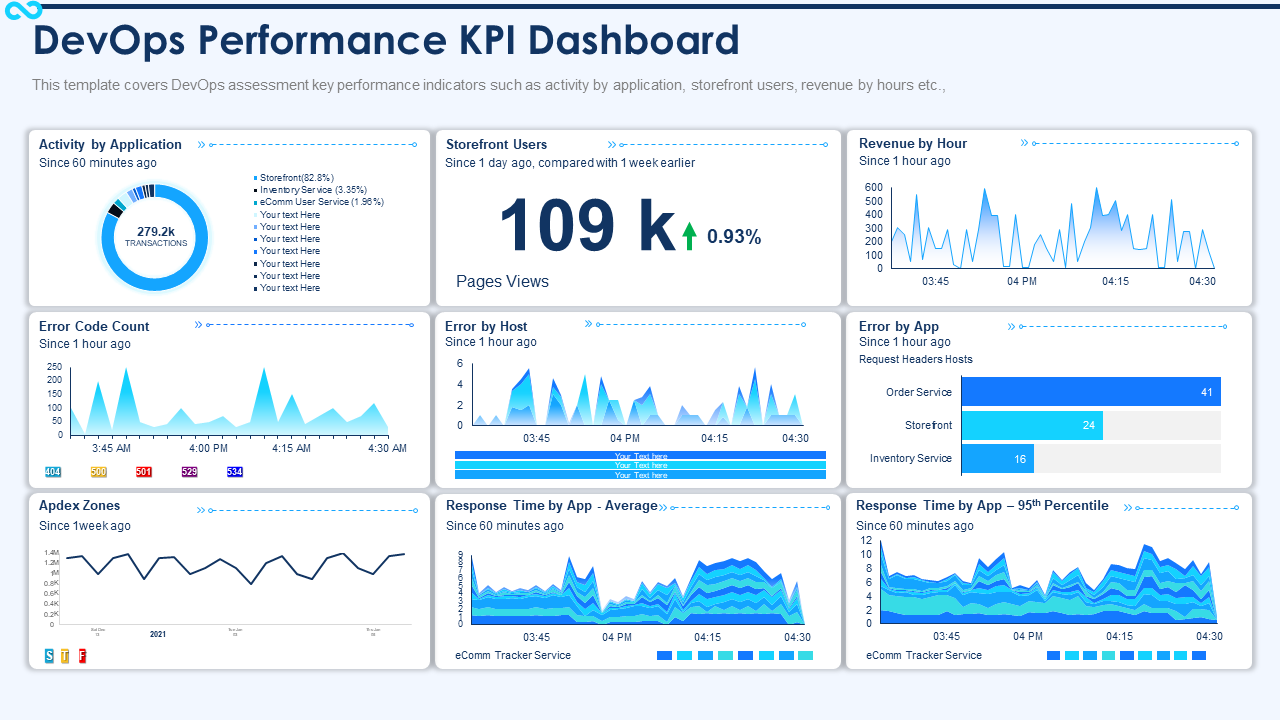
Template 6: DevOps Performance KPI Dashboard
Assess the strengths and weaknesses of your team’s performance with this eye-catching dashboard, which presents crucial metrics that help to invigorate the development process. The indicators covered in this template include activity by applications, revenue by hour, storefront users, error by host, error by app, response time by app – average and response time by app – 95th percentile.
Template 7: DevOps Application Monitoring Dashboard
This template helps you keep a watch on the application streams within your DevOps projects, designed to present a richness of data in an easy-to-follow manner. Covered within the template are downtime by monitor, deploy status dashboard, uptime by location, unit tests and latest status. Download the template and adapt it to suit your team’s requirements.
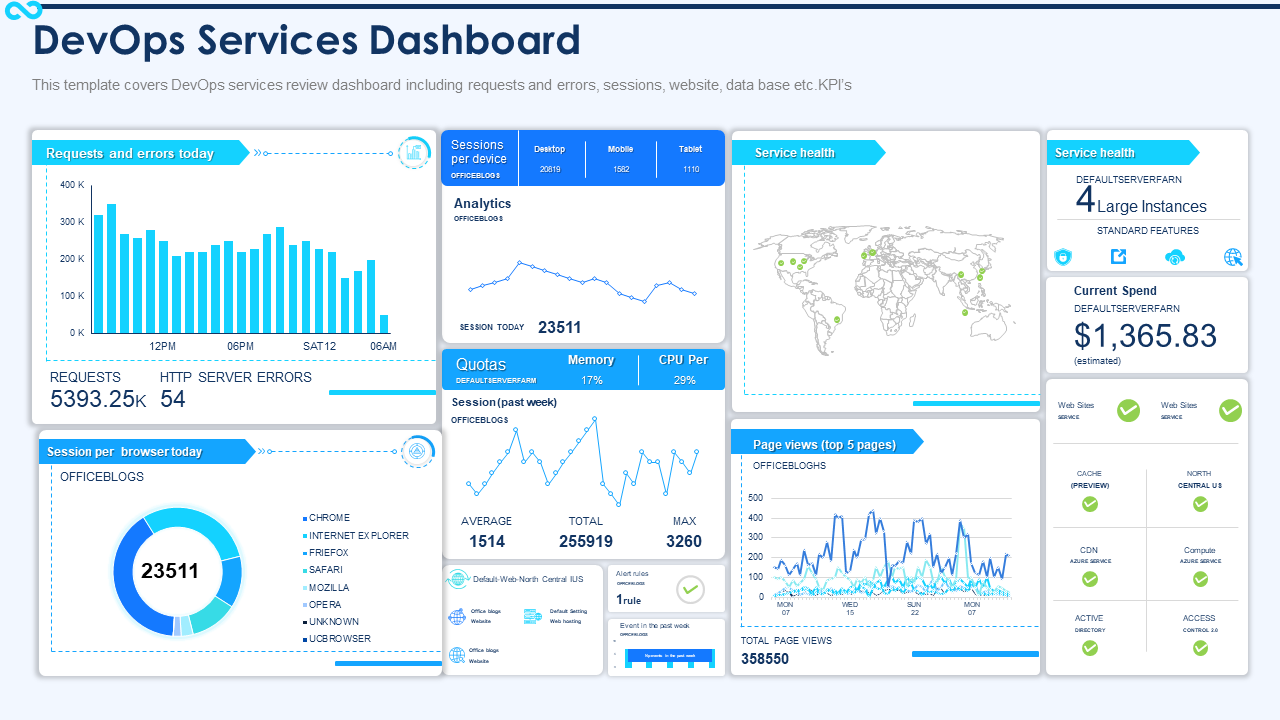
Template 8: DevOps IT Services Snapshot Dashboard
Seeking to access a level of transparency and insight into your IT operations? Download this template today to have your wish. Some of the performance metrics covered here are requests and errors, sessions per browser today, page views and ‘sessions per device. Deliver a strong presentation where you keep track of progress and course correct as you go along.
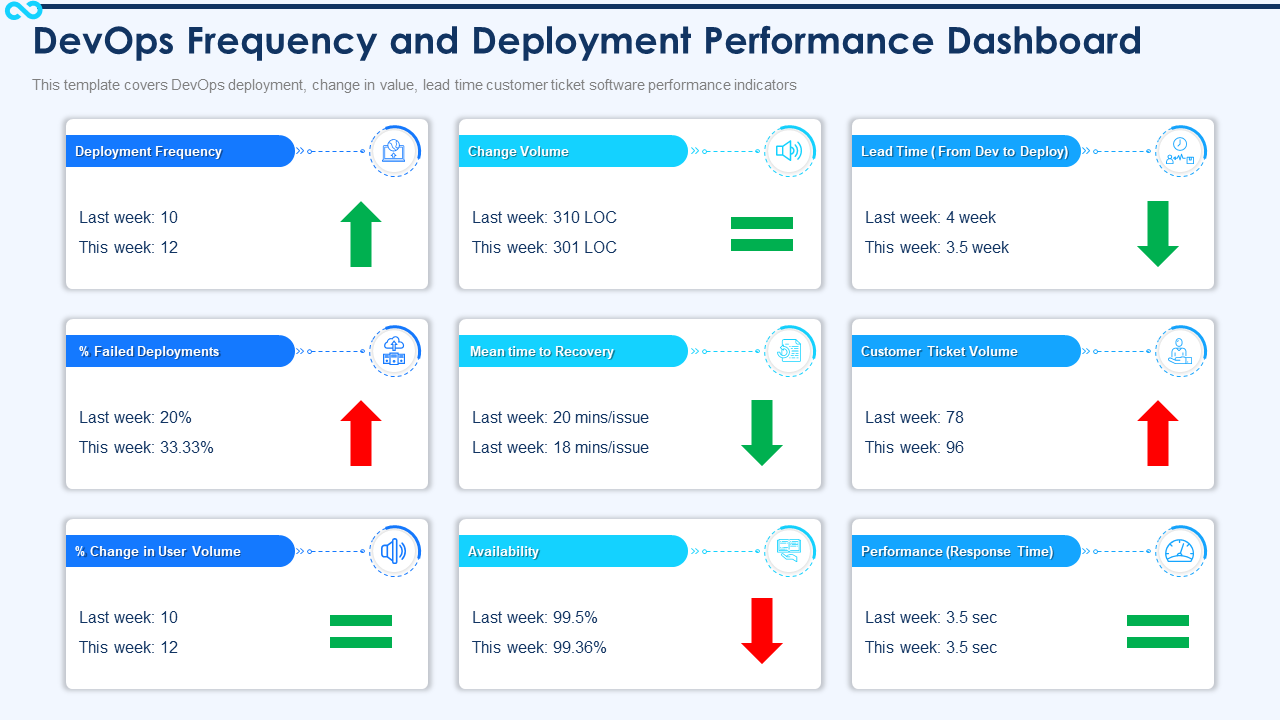
Template 9: DevOps Frequency and Deployment Performance Dashboard
Cast a critical eye on software performance with the aid of this slick-looking template, which is fully customizable and comes in nine stages. Tracking the lead time is easier with this slide, which also covers deployment frequency, change volume, availability, performance, mean time to recovery and customer ticket volume, allowing you a more extensive picture into the moving parts of your project.
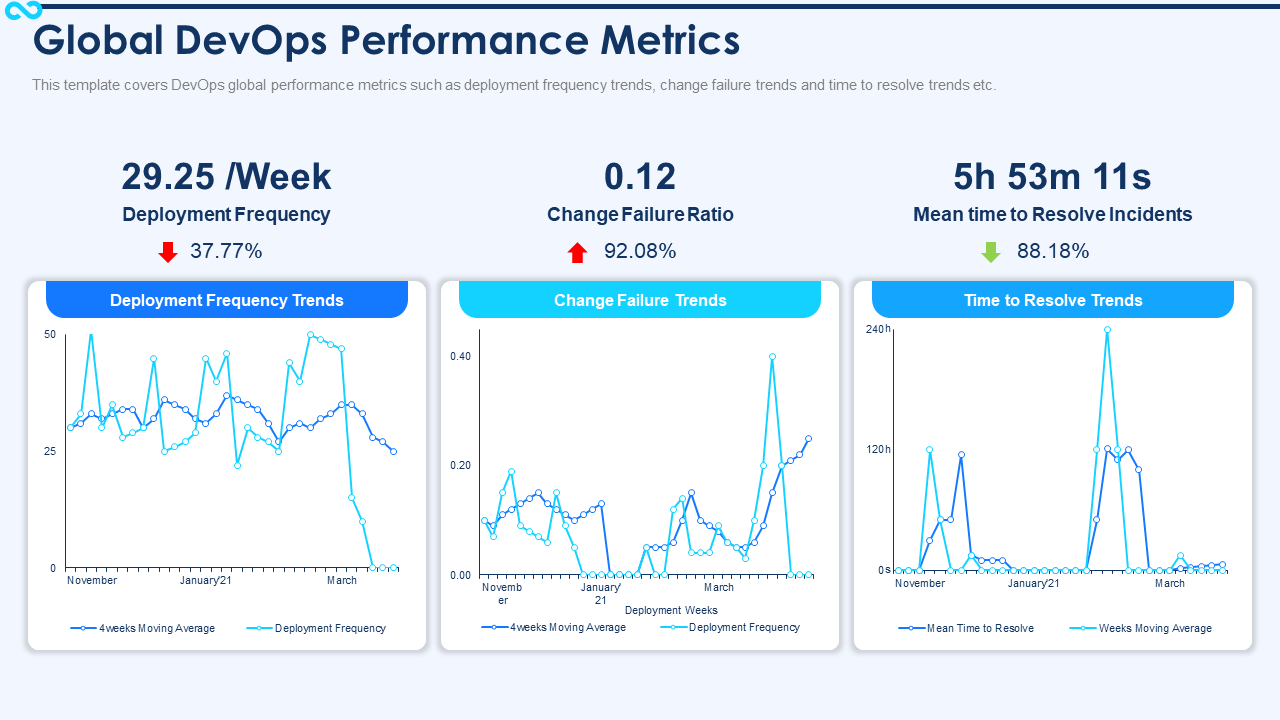
Template 10: DevOps Global Performance Metrics Dashboard
Presenting a template which guarantees that tracking change is easier and more rewarding. The statistics on display here are deployment frequency, change failure ration and mean time to resolve incidents. The dashboard makes a powerful statement with its simple, clean, elegant design, and is, of course, fully customizable as always.
Sound businesses need dashboards
Having the right product and a good team is just one dimension of sound business. Doing the math, crunching down the data and course correcting when things go wrong is the other. With these dashboards that we’ve laid out for you here in this article, we hope we can give you the edge you need in the ever-changing business domain, merging flexibility and efficiency for a soundproof experience.
FAQs on DevOps
What are DevOps tools?
DevOps tools assist in bolstering and enhancing the software development process. The primary function of a DevOps tool would be to improve, streamline and facilitate collaboration and engagement between arms of a business – specifically, the software development wing, product management and operations. DevOps tools also allow a business to inject automation into most of the development processes, thereby boosting the productivity of the corporation while decreasing manual labor.
What are DevOps metrics?
Data points that reflect the performance of a DevOps software development channel are, essentially, DevOps metrics. These help companies swiftly narrow down and eliminate issues in software development process. Such metrics are used by corporations to monitor both team performance and the technical accomplishments of the product. With these metrics, companies assess and critically examine the collaborative work processes while keeping their eyes on progress.
How to create a DevOps dashboard?
Azure DevOps is a product of Microsoft and is the engine behind most dashboards in the blog. To create one yourself, simply visit the Azure portal and in dropdown of the menu on the left, click ‘Dashboard’. Select ‘Blank Dashboard’ on the dashboard plane. From there, modify, amend, and alter the dashboard as per your needs.





 Customer Reviews


