In this highly competitive business world, you, as a marketer, must keep up with the market trends to make your brand visible. This requires planning a new marketing campaign every now and then, something that can be challenging, especially when you don't have the slightest idea of how to monitor it.
Without effective scheduling and monitoring, your projects will run foul of deadlines, and everything will turn into chaos.
One of the most popular ways for marketing teams to make their projects more manageable is by creating and maintaining Gantt Charts (Designed around 1912 by Henry Gantt). This scheduling tool has been and still is a standard project management planning and scheduling tool over a century later.
Gantt Charts help marketers visualize project timelines, progress, and deliverables. It includes graphical lines or bars that display tasks, progress, and status, allowing managers to allocate time and responsibility. The chart is beneficial for marketers who need to maintain team momentum on campaigns with activities like product launches or marketing events.
If you want to improve your marketing processes, you must be able to build a Gantt Chart in minutes, with a timeline to stay on schedule and hit your deadlines. SlideTeam presents the most popular Marketing Gantt Chart Templates collection with samples and examples to assist you.
Marketing Gantt Chart Templates
All these templates are customizable, and you can modify these per your business needs. With these PPT Slides, you can map out an effective plan and share it with your team to get everyone on the same page.
Template 1: Marketing Project Gantt PowerPoint Presentation
If you are looking for a collection of Gantt Charts where you can plan your entire project, this PPT Presentation is an ideal pick. It includes charts for all project functions, such as digital marketing, website development, marketing promotion tasks, etc. With this PPT Template, you can streamline the process of scheduling your activities and can deliver your project on time. Get it today!
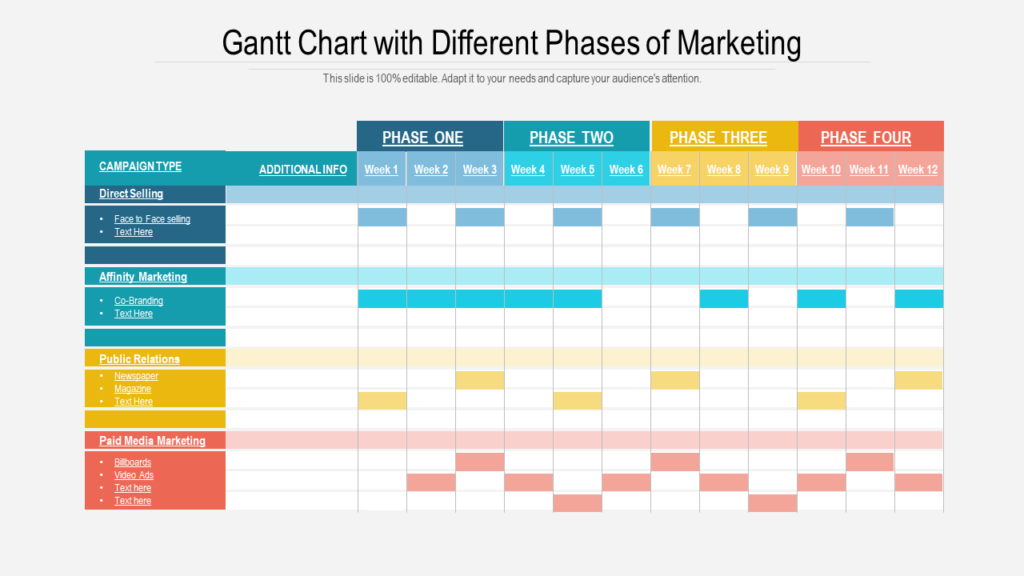
Template 2: Gantt Chart Template with Marketing Phases
Presenting a Gantt Chart with vibrant colors to help you schedule activities for phases of marketing. It will help you plan campaigns, such as direct selling, public relations, affinity marketing, and paid media marketing. This PPT Template divides marketing initiatives into four phases; each is three-week long. This layout allows you to finish your campaign in twelve weeks to ease your workload. Download now!
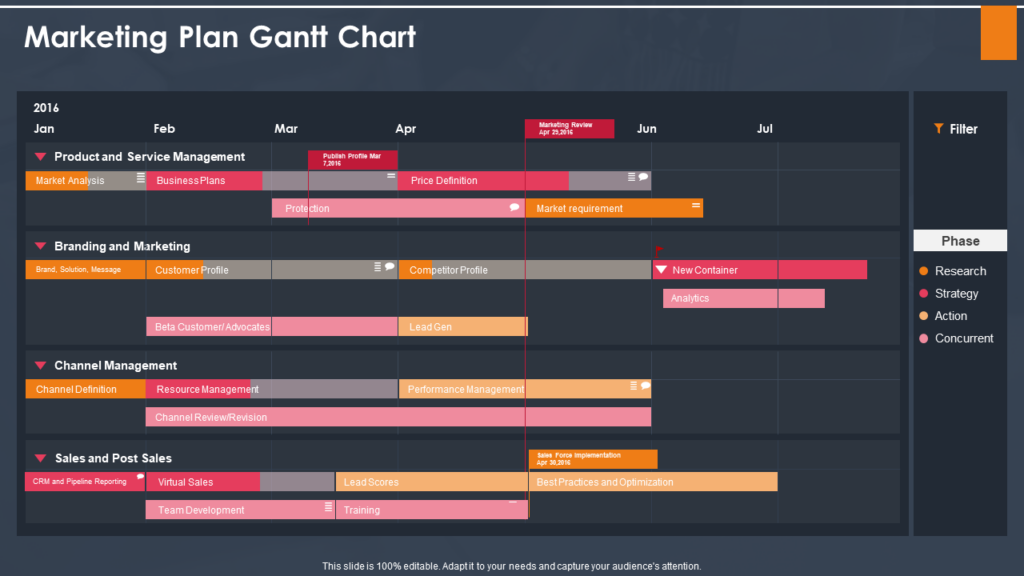
Template 3: Marketing Plan Gantt Chart Template
Using this marketing plan Gantt chart template can help you organize and track the progress of your marketing efforts, identify any delays or roadblocks, and ensure that tasks and activities are completed on time. It can also help you communicate your plan to stakeholders, such as team members or executives, by providing a clear and visual overview of the plan. The dark theme used in this slide gives it a more professional look. Download it today!
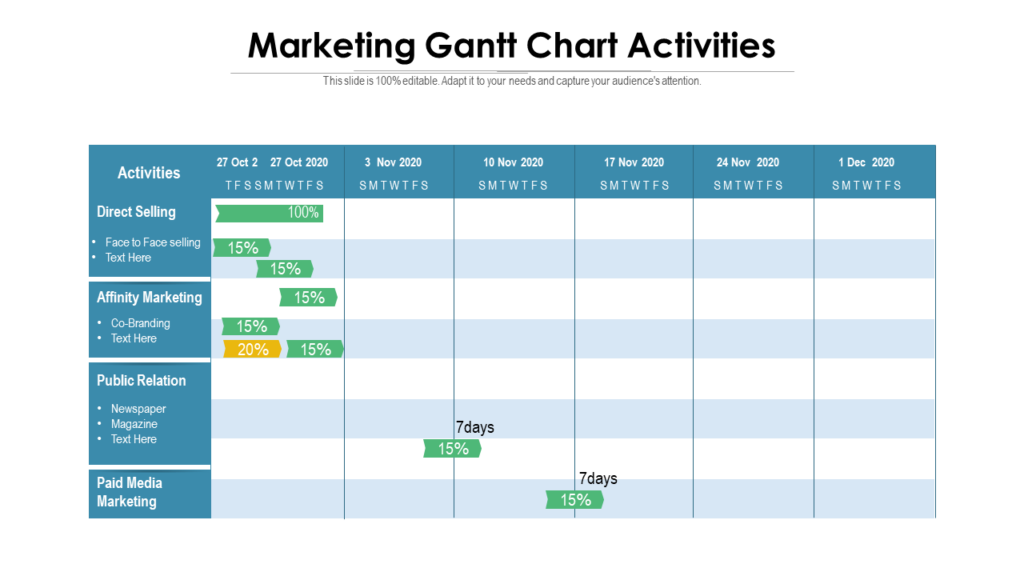
Template 4: Marketing Gantt Chart Activities Template
Presenting a simple yet helpful PPT Template to define your marketing activities and their timeline. This Gantt Chart format shows the start and end dates of tasks or activities, as well as their dependencies and resources required to complete them. It also includes a list of associated tasks with the marketing plan. Download it now to streamline the implementation of your marketing activities.
Template 5: Marketing Gantt Chart PPT Example
Use this comprehensive Gantt Chart Template to resolve the confusion in your team related to campaigns, their duration, and their due dates. It allows you to do annual planning for twelve releases with their start and end dates. You can add or remove the number of campaigns as per your business need. It also has a separate column to record the status of the campaigns. Get it today!
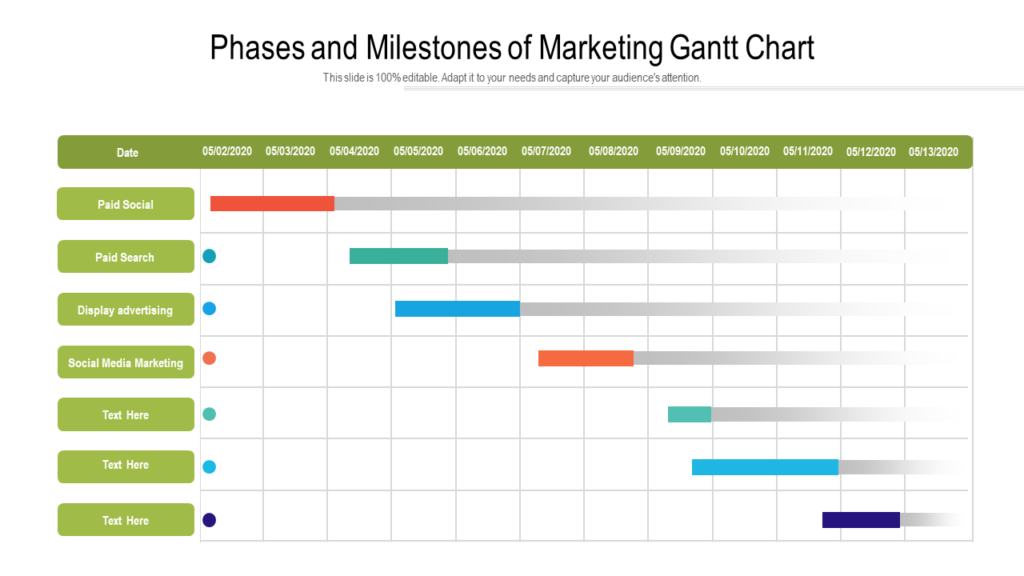
Template 6: Marketing Gantt Chart PPT Sample
In this Marketing Gantt chart, you can include the completion of key tasks or activities, the launch of a marketing campaign, or the achievement of specific marketing goals. As the phases and milestones of a marketing Gantt Chart vary depending on the organization's needs and goals, you can customize this chart to reflect the unique needs and goals of the marketing plan. It is a simple framework that includes the type of campaign and its timeline. If you need a layout with clutter-free design and clarity, this template is an ideal pick. Get it now!
Template 7: Quarterly Gantt Chart Template
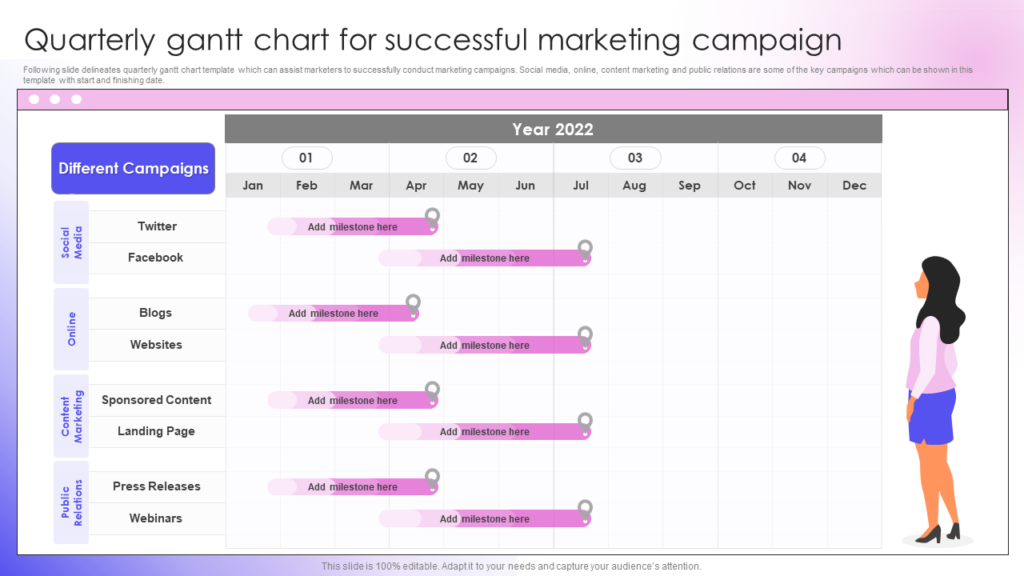
If you want to plan your marketing campaigns quarterly, here’s a perfect PPT Template to assist you. This template helps you streamline your marketing implementation by dividing your annual plan into quarters. It includes four marketing campaigns: Social Media, Online, Content Marketing, and Public Relations. And further divides them into different channels and activities. Grab it today to schedule and track your marketing efforts across verticals. Get it today!
Template 8: New Product Go to Market Gantt Chart
Are you planning to launch a new product? If you want it to be successful, consider using this new product go-to-market Gantt Chart to plan and schedule effective marketing strategies. It includes four crucial stages of launching a new product. These are Development, Closed Beta, Open Beta, and General Release. The best part about this PPT Slide is that it lets you mention the name of the people responsible for each activity. It also allocates colors to the status of each campaign, such as Blue is for complete, Red means in progress, and Pink means the task is in waiting. Download it today!
Template 9: 30-60-90 Days Sales and Marketing Plan Gantt Chart
If you struggling to plan activities for your new sales and marketing employees, you must explore these 30-60-90 days sales and marketing plan Gantt Chart. This PPT Sample will help you schedule a plan for market assessment, research, strategy implementation, and more. This marketing and sales plan allows a 30-day plan to establish initial requirements. The next 30 days determine the target market for the sales. The 90 days plan shows the end goal of the sales plan and how to achieve it. Grab it now!
Template 10: Digital Marketing Gantt Chart Template
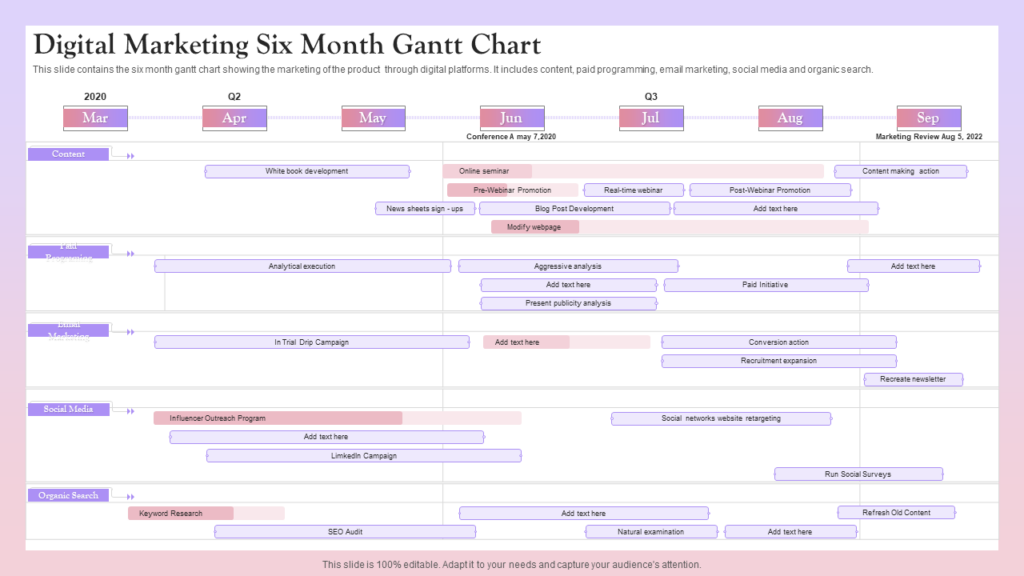
This PPT Template is meant only for digital marketing professionals. The six-month Gantt Chart includes timelines for digital marketing techniques, such as content, paid programming, email marketing, social media, and organic search. The light shades of pink and purple give this template a more subtle appearance. Download it now!
Know what success looks like
A Gantt chart is a visual description of a project’s timeline and shows the start and end dates of a project’s components, such as resources and planning. If you are involved in a marketing project and want to create your Gantt Chart, refer to our examples on the list. Download these PPT Templates now to get started.
PS If you are looking for marketing plan PPT Templates, here’s a handy guide with some amazing samples and examples.
FAQs on Marketing Gantt Chart
What are the benefits of using Gantt Charts in marketing?
A Gantt Chart is a type of project management tool that helps marketers visualize and plan tasks, resources, and timelines for marketing campaigns and projects. Some benefits of using a marketing Gantt chart include:
Improved organization: A marketing Gantt Chart helps marketers organize tasks and resources in a clear, visual way, making it easier to see what needs to be done and when.
Enhanced communication: A marketing Gantt Chart can be shared with team members and stakeholders, helping everyone stay on the same page and understand their roles and responsibilities.
Better project management: A marketing Gantt Chart allows marketers to track progress, identify and address any issues or delays, and make necessary adjustments to the project plan.
Increased efficiency: A marketing Gantt Chart helps marketers work more efficiently and effectively by identifying and scheduling tasks and resources in advance.
Better collaboration: A marketing Gantt chart helps team members collaborate and coordinate their efforts, leading to a more cohesive and successful marketing campaign.
Who invented the Gantt Chart?
The Gantt Chart was invented by Henry Gantt, an American mechanical engineer and management consultant, in the early 1900s. Gantt developed the chart as a visual tool to help managers plan and track the progress of complex projects, and it quickly became a popular method for project management in various industries. Gantt Charts are named after him in recognition of his contributions to the field of project management.
What are the components of a Gantt Chart?
A Gantt Chart comprises:
A task list: This is the list of tasks that need to be completed as part of the project. Each task is listed in a row, with the task name and a description of the work to be done.
Timeline: This is a horizontal axis that represents the project duration. The timeline is divided into equal intervals, such as days, weeks, or months, depending on the length of the project.
Taskbars: Each task is represented by a bar on the chart, with the start and end dates of the task indicated by the left and right edges of the bar, respectively. The length of the bar represents the duration of the task.
Milestones: These are significant events or achievements in the project that are marked on the chart with a diamond or other symbol.
Dependencies: These are the relationships between tasks, such as one task that must be completed before another can begin. Dependencies are often indicated on the chart with a line connecting the two tasks.
Resource allocation: This is the allocation or mapping of people, equipment, or materials, to tasks on the chart. Varying colors or symbols may be used to represent resources on the chart.




 Customer Reviews


