


Quality Indicator Dashboard Powerpoint Ppt Template Bundles


Try Before you Buy Download Free Sample Product
 Impress Your
 Audience
Editable
of Time


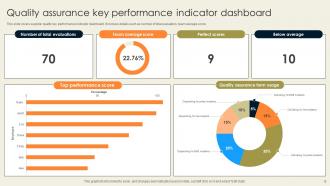
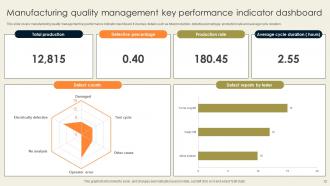
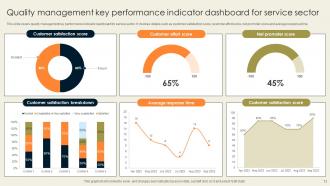
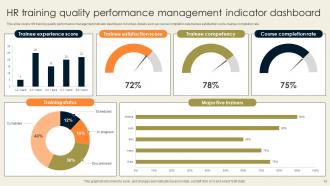
Our Quality Indicator Dashboard Powerpoint Ppt Template Bundles are topically designed to provide an attractive backdrop to any subject. Use them to look like a presentation pro.
People who downloaded this PowerPoint presentation also viewed the following :
Quality Indicator Dashboard Powerpoint Ppt Template Bundles with all 20 slides:
Use our Quality Indicator Dashboard Powerpoint Ppt Template Bundles to effectively help you save your valuable time. They are readymade to fit into any presentation structure.


FAQs for Quality Indicator Dashboard Powerpoint
Okay so for your dashboard, start with just 3-5 metrics that actually move the needle - nobody wants to wade through a million charts. Real-time data is huge because you can catch problems before they blow up. Set clear benchmarks so people know if you're winning or losing. Your stakeholders will definitely want to drill down into specifics (they always do), so build that in. And honestly? Automated alerts are a lifesaver when things go wrong. I learned this the hard way - dashboards full of vanity metrics just make everyone feel good but don't help much.
Okay so first thing - figure out what KPIs actually make sense for your industry. Like patient safety stuff if you're in healthcare, defect rates for manufacturing, whatever. Most platforms let you customize everything anyway, so that's not the hard part. Here's where people mess up though - they create these absolute nightmare dashboards with like 20 different metrics. Don't do that. Stick to maybe 5-7 things that people will actually look at when making decisions. I'd map out what different teams need to see first, then build separate views for each group. Way better than cramming everything into one monster dashboard that nobody wants to use.
Start with outcome stuff - readmission rates, mortality, patient safety indicators. Those matter most obviously. Process metrics like medication adherence are solid leading indicators too. Don't sleep on patient satisfaction scores though, they get ignored way too much and patients actually know what's up. Cost per case keeps the lights on. Honestly? Pick maybe 5-7 metrics that match what your org actually cares about, then build from there. I made the mistake once of trying to track everything at launch - total disaster. Keep it simple first.
Dude, visualization is a game changer for quality metrics. Raw spreadsheets? Total nightmare to parse through. But throw that same data into charts and color-coded dashboards - suddenly patterns just jump out at you. It's wild how much faster you can spot what's tanking vs what's crushing it. I learned this the hard way after spending way too many late nights squinting at Excel rows. Pick maybe 3 key metrics to start with and mess around with different chart styles until something clicks for your team. Trust me, once you see trends visually instead of hunting through numbers, you'll never go back.
Look, real-time data is like having GPS instead of that crusty 2015 paper map in your glove compartment. You catch problems as they happen rather than finding out weeks later when it's too late to do anything useful about it. Way better than waiting for some monthly report that's basically ancient history at that point. Your team can actually jump on issues before they turn into expensive disasters. Honestly, just set up alerts for the important stuff so you're not glued to dashboards 24/7. The faster you see something's off, the quicker you can fix it.
Look, if your dashboard is a pain to use, people just won't touch it. Period. I've seen this happen so many times - teams spend months building these fancy tools, then everyone ignores them because they're too confusing. You want something clean and logical that doesn't require a manual to figure out. Staff are already buried in work, so they'll bounce if it takes more than a few clicks to find what they need. When it's actually intuitive, people start checking those quality metrics regularly instead of just during meetings when someone asks.
Honestly, the worst thing you can do is jam everything onto one screen. I've worked with teams that had like 20 charts nobody even glanced at - total waste. Focus on maybe 3-5 metrics that actually matter to whoever's using it. Skip the vanity stuff that looks cool but doesn't help anyone make decisions. Also, check your data quality because outdated numbers make everything pointless. You'll want metrics people can actually act on, not just pretty graphs. Oh and resist the urge to keep adding more - that's how you end up back where you started!
So these dashboards basically show you what's really going on vs what you think is happening - super helpful for catching problems early. Instead of waiting forever for reports, you're seeing current data that actually makes sense visually. My old boss was obsessed with tracking everything though, which was annoying. The trick is focusing on metrics that matter for your specific goals, not just random numbers that look impressive. You'll spot trends and bottlenecks way faster. Honestly saves tons of headaches later when things would've blown up otherwise. Just make sure your team can actually understand the visuals.
Honestly? Start with what you're already using - if you've got Microsoft stuff, Power BI is probably your easiest bet. Tableau's great too but can get pricey. Qlik Sense is pretty user-friendly if you want something different. Now if you're into coding (or have someone who is), R Shiny gives you way more control over customization. Python with Dash works too. I'd actually map out your key metrics first though - like what do you really need to see daily vs monthly? That'll help you figure out which tool makes the most sense. Budget matters too obviously. Most of these have free trials so you could always test drive a couple.
Track if people actually change what they're doing based on your dashboard data - that's the big one. Compare your key metrics (patient outcomes, error rates, whatever matters most) from before and after. Honestly, the hardest part is figuring out what's really from the dashboard vs other stuff you're doing at the same time. Survey your team to see if they feel better informed when making calls. Short, punchy reviews work best - just baseline numbers against current performance. That combo should tell you if it's actually making a difference or just looking pretty on screens.
Focus on three main things: validating your data sources, setting up automated checks, and auditing regularly. Make sure your source systems are feeding clean data into the dashboard - this part's honestly crucial. Set up alerts for weird stuff like random spikes or missing values. I've watched perfectly good dashboards turn into garbage because nobody caught bad data early enough! You'll also want regular spot-checks where you compare dashboard numbers against the original reports. Oh, and document where all your data comes from so you can actually troubleshoot when things go sideways.
Set up regular check-ins with your stakeholders - maybe quarterly or monthly if they're heavy users. Coffee chats work great for this, honestly better than formal meetings. Create easy ways for them to report bugs or suggest new metrics. Quick surveys are solid too, or just grab a few key users for brief focus groups. The dashboards that actually get used are the ones that keep evolving based on what's frustrating people day-to-day. Don't make feedback feel like homework they'll dodge - keep it casual and routine. I've seen too many beautiful dashboards that nobody touches because they weren't built for real workflow.
Honestly, the trick is mixing your numbers with actual stories that explain what's happening behind the data. Drop in quick case studies or real quotes from people right next to your charts. Makes everything way more believable. Keep the story bits super short though - like 1-2 sentences tops so they don't compete with your visuals. I usually group related stories and numbers together instead of putting them in separate sections. Oh and this might be obvious but those dashboards with zero context always feel so sterile to me. You want your data to actually mean something to whoever's looking at it.
Honestly, check them every 2-3 weeks - monthly feels too slow these days. Your dashboard updates on its own (if the feeds aren't broken), but you actually need to look at what you're tracking. Block 30 minutes with your team biweekly and ask "does this still matter?" Things move so fast that what felt critical last quarter might be totally useless now. I learned this the hard way when we kept tracking metrics that literally nobody cared about anymore. Short sentences work better for these reviews. If something looks stale, just swap it out right away - don't overthink it.
Start with dashboard basics - filtering data, drilling down, reading the charts. That's the easy part though. The real challenge? Getting them to understand what readmission rates actually mean for patients, not just numbers on a screen. I'd do hands-on sessions with real scenarios where they can mess around and ask questions. Honestly, peer training works way better than formal presentations. Find your tech-savvy people first and let them teach the others. People trust their coworkers more than some outside trainer anyway.
-
Awesome presentation, really professional and easy to edit.
-
Thank you for offering such helpful pre-designed templates. They are really beneficial to me in my job.