

Quality Report Powerpoint Ppt Template Bundles





Try Before you Buy Download Free Sample Product
 Impress Your
Audience
 100%
Editable
 Save Hours
of Time


Our Quality Report Powerpoint Ppt Template Bundles are topically designed to provide an attractive backdrop to any subject. Use them to look like a presentation pro.
People who downloaded this PowerPoint presentation also viewed the following :
Quality Report Powerpoint Ppt Template Bundles with all 19 slides:
Use our Quality Report Powerpoint Ppt Template Bundles to effectively help you save your valuable time. They are readymade to fit into any presentation structure.











FAQs for Quality Report Powerpoint
Key elements in a quality report template include executive summary, quality metrics and KPIs, compliance status, defect analysis, corrective actions, and improvement recommendations. These components enable organizations to track performance trends, identify process gaps, and demonstrate regulatory compliance, with many manufacturing and healthcare institutions finding that structured reporting ultimately delivers enhanced operational transparency and faster issue resolution.
A quality report template enhances data presentation by standardizing formats, organizing information logically, incorporating visual elements like charts and graphs, and establishing consistent metrics across reporting periods. These structured frameworks enable stakeholders in manufacturing, healthcare, and financial services to quickly identify trends, compare performance benchmarks, and make informed decisions, ultimately delivering improved transparency and faster strategic responses.
Effective quality report templates incorporate clean layouts with consistent typography, strategic use of white space, and intuitive data visualization through charts and graphs. These design elements enhance readability by organizing complex information hierarchically, using color coding for different metrics, and maintaining brand consistency, ultimately delivering professional presentations that stakeholders can quickly interpret and act upon.
Different industries adapt quality report templates by customizing metrics, compliance standards, reporting frequencies, and stakeholder requirements to align with their operational priorities. Manufacturing focuses on defect rates and production efficiency, healthcare emphasizes patient safety indicators, while financial services prioritizes risk assessments and regulatory compliance, with many organizations finding that industry-specific adaptations streamline auditing processes and enhance decision-making capabilities.
Feedback plays a crucial role in refining quality report templates by identifying gaps in data presentation, clarity issues, and stakeholder needs. Through regular input from management teams, quality assurance professionals, and end-users, organizations continuously enhance template effectiveness, streamline reporting processes, and ensure templates deliver actionable insights that drive operational improvements and strategic decision-making.
Automation tools integrate into quality report templates through real-time data feeds, automated metric calculations, scheduled report generation, and dynamic dashboards that update continuously. These technologies streamline reporting processes by eliminating manual data entry, reducing human error, and enabling instant performance tracking, with many manufacturing and healthcare organizations finding that automated quality reporting delivers faster insights and significantly improved operational efficiency.
Common pitfalls include overcomplicating the template with excessive metrics, using inconsistent formatting across sections, failing to align with stakeholder requirements, and creating rigid structures that don't accommodate different project types. Many organizations find that unclear visual hierarchies, missing context for data interpretation, and inadequate feedback mechanisms ultimately undermine report effectiveness and user adoption.
Customizable templates deliver superior value by enabling brand alignment, flexible data visualization, automated workflows, stakeholder-specific reporting formats, and scalable formatting across departments. Unlike generic alternatives, these templates allow organizations to incorporate company-specific KPIs, regulatory requirements, and visual standards, ultimately enhancing report credibility, streamlining review processes, and supporting strategic decision-making with tailored insights.
Cultural differences significantly influence quality report templates through communication styles, hierarchical structures, data presentation preferences, and regulatory requirements across different regions. Organizations operating internationally must adapt their templates to accommodate varying cultural expectations, with Japanese companies favoring detailed process documentation while Western firms emphasize executive summaries, ultimately ensuring stakeholder engagement and compliance effectiveness.
A comprehensive framework includes clarity assessment, stakeholder feedback mechanisms, data accuracy validation, actionable insights measurement, and compliance verification standards. Through systematic evaluation across these dimensions, organizations in manufacturing, healthcare, and financial services can streamline reporting processes, enhance decision-making transparency, and ultimately deliver more effective quality management outcomes while ensuring regulatory adherence.
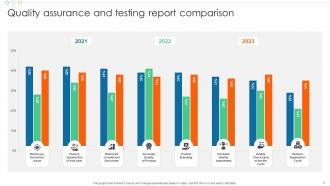
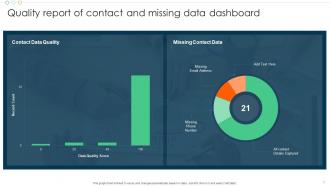
Data visualization in quality reports should emphasize clarity, accuracy, and actionable insights through charts, graphs, trend lines, and performance dashboards that highlight key metrics and variances. These visual elements enable stakeholders to quickly identify patterns, track improvement progress, and make data-driven decisions, with many organizations finding that well-designed visualizations significantly enhance report comprehension and strategic response times.
A well-designed quality report template accelerates decision-making by presenting critical data clearly, highlighting key performance indicators, and establishing consistent evaluation criteria across departments. These templates enable executives to quickly identify trends, compare performance metrics, and allocate resources strategically, with many organizations finding that standardized reporting reduces analysis time while improving accuracy and organizational alignment.
Organizations ensure consistency across quality report templates through standardized formatting guidelines, centralized template libraries, and mandatory approval workflows for template modifications. These frameworks streamline reporting by establishing uniform data presentation standards, common terminology usage, and consistent evaluation criteria, with many companies finding that standardized templates reduce reporting errors by up to 40% while enhancing cross-departmental collaboration.
Best practices for updating quality report templates include establishing regular review cycles, incorporating stakeholder feedback, maintaining version control, standardizing data collection methods, and ensuring regulatory compliance alignment. Through systematic template maintenance, organizations streamline reporting processes, enhance data accuracy, and improve decision-making capabilities, with many finding that consistent updates ultimately deliver better audit outcomes and operational transparency.
Templates help streamline team reporting by standardizing data collection, reducing preparation time, ensuring consistent formatting, and minimizing errors across different team members. Through pre-built structures and automated sections, teams in manufacturing, healthcare, and financial services can focus on analysis rather than formatting, ultimately delivering faster insights and improved collaboration while maintaining quality standards.
-
SlideTeam is a great place for PPT templates. They have many templates on a single topic. It has made my life a lot easier.
-
Topic best represented with attractive design.