


Finance Portfolio Management KPIs And Dashboard Powerpoint Presentation Slides





Try Before you Buy Download Free Sample Product
 Impress Your
 Audience
 100%
100% Editable
 Save Hours
 of Time


Presenting our Finance Portfolio Management KPIs And Dashboard PowerPoint Presentation Slides. Select the best marketing strategy for your company by employing these investment portfolio PPT slides. Display the performance of your assets and brand systematically and in an organized manner through these portfolio management PPT templates. Highlight the ongoing projects, the budget required, and the total cost summary in a comprehensive way taking aid of our stocks portfolio PPT layouts. This capital portfolio PPT deck allows you to present a detailed cost and benefit analysis, the timeline for the target, and risks and change requests analysis of your business. Apply KPIs metrics for the financial overview of your business by successfully employing our investment management PowerPoint presentation. Educate your viewers about your company’s vision, mission, and goals with the assistance from this expertly created and concept-specific assets portfolio PPT presentation. Download this fiscal portfolio PPT slideshow and innovatively present your strategies by taking advantage of our thousands of available and editable graphs, charts, icons, shapes, etc.
People who downloaded this PowerPoint presentation also viewed the following :
Content of this Powerpoint Presentation
Slide 1: This title slide presents the Finance Portfolio Management KPIs and Dashboard. Add the name of your company here.
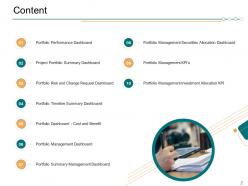
Slide 2: This slide contains the Content. It includes - Portfolio Performance Dashboard, Project Portfolio Summary Dashboard, Portfolio Risk and Change Request Dashboard, Portfolio Timeline Summary Dashboard, Portfolio Dashboard: Cost and Benefit, Portfolio Management Dashboard, Portfolio Summary Management Dashboard, Portfolio Management Securities Allocation Dashboard, Portfolio Management KPI’s, and Portfolio Management Investment Allocation KPI.
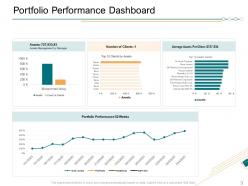
Slide 3: This slide presents the Portfolio Performance Dashboard.
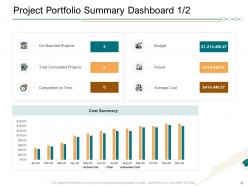
Slide 4: This slide presents the Project Portfolio Summary Dashboard 1/2.
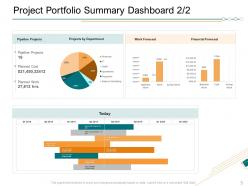
Slide 5: This slide presents the Project Portfolio Summary Dashboard 2/2.
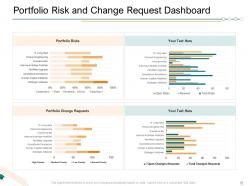
Slide 6: This slide presents the Portfolio Risk and Change Request Dashboard.
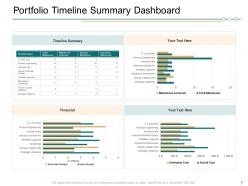
Slide 7: This slide presents the Portfolio Timeline Summary Dashboard.
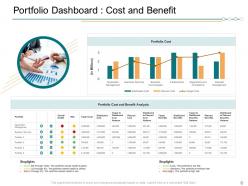
Slide 8: This slide presents the Portfolio Dashboard: Cost and Benefit.
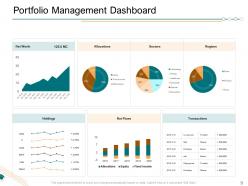
Slide 9: This slide presents the Portfolio Management Dashboard.
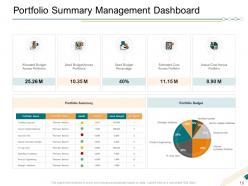
Slide 10: This slide presents the Portfolio Summary Management Dashboard.
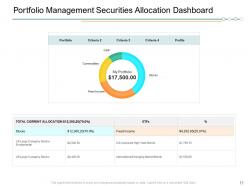
Slide 11: Portfolio Management Securities Allocation Dashboard.
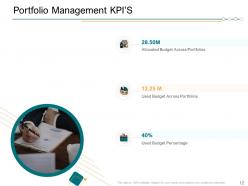
Slide 12: This slide presents the Portfolio Management KPI’s.
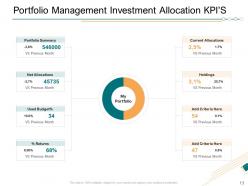
Slide 13: This slide presents the Portfolio Management Investment Allocation KPI’s.
Slide 14: This is the Icons Slide for Finance Portfolio Management KPIs and Dashboard.
Slide 15: This is the Coffee Break slide.
Slide 16: This slide introduces the Additional Slides.
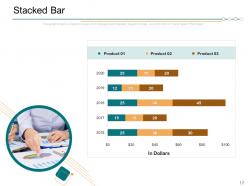
Slide 17: This slide shows a Stacked Bar that compares 3 products’ finances over a timeline of years.
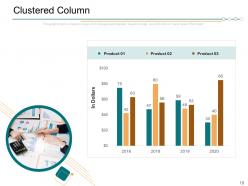
Slide 18: This slide shows a Clustered Column that compares 3 products’ finances over a timeline of years.
Slide 19: This slide provides the Mission for the entire company. This includes the vision, the mission, and the goal.
Slide 20: This slide shows the members of the company team with their name, designation, and photo.
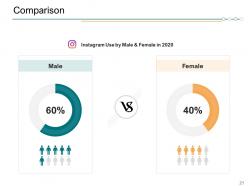
Slide 21: This slide presents a comparison between the percentage of male and female Instagram users.
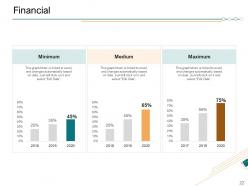
Slide 22: This slide presents the Financial with a data’s numbers at minimum, medium, and maximum percentage.
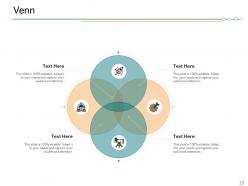
Slide 23: This slide provides a Venn diagram that can be used to show interconnectedness and overlap between various departments, projects, etc.
Slide 24: This is a Thank You slide where details such as the address, contact number, email address are added.
Finance Portfolio Management KPIs And Dashboard Powerpoint Presentation Slides with all 24 slides:
Use our Finance Portfolio Management KPIs And Dashboard Powerpoint Presentation Slides to effectively help you save your valuable time. They are readymade to fit into any presentation structure.




FAQs for Finance Portfolio Management KPIs And Dashboard
Critical KPIs for finance portfolio performance include return on investment (ROI), Sharpe ratio, alpha generation, maximum drawdown, and portfolio volatility metrics. These indicators enable portfolio managers to assess risk-adjusted returns, benchmark performance, and capital efficiency across diverse asset classes, with many institutional investors finding that combining profitability measures with risk metrics delivers comprehensive performance insights and competitive investment advantage.
Risk-adjusted return metrics enhance portfolio management by evaluating performance relative to volatility, enabling more informed investment decisions through measures like Sharpe ratio, Treynor ratio, and alpha calculations. These metrics help portfolio managers identify underperforming assets, optimize asset allocation across diverse markets, and demonstrate value to clients, with many financial institutions finding that risk-adjusted analysis ultimately delivers superior long-term returns and competitive differentiation.
Liquidity ratios serve as critical KPIs in portfolio management by measuring an organization's ability to meet short-term obligations, convert assets to cash, and maintain operational flexibility during market volatility. These ratios enable portfolio managers to assess risk exposure, optimize asset allocation, and ensure adequate cash reserves, with investment firms and pension funds finding that strong liquidity metrics ultimately deliver enhanced portfolio resilience and strategic positioning.
Portfolio diversification can be quantified through KPIs including correlation coefficients between assets, sector allocation percentages, geographic distribution ratios, asset class weightings, and concentration risk metrics. These measurements enable portfolio managers to assess risk exposure across different markets, with investment firms finding that tracking diversification scores and Herfindahl indices ultimately delivers better risk-adjusted returns and enhanced portfolio stability.
The Sharpe ratio measures risk-adjusted returns by comparing portfolio excess returns to volatility, helping investors understand whether higher returns justify additional risk taken. This metric enables portfolio managers to evaluate performance beyond simple returns, with many institutional investors and wealth management firms finding that higher Sharpe ratios indicate more efficient risk utilization, ultimately delivering better risk-adjusted performance comparisons.
Expense ratios directly reduce portfolio returns by subtracting annual fees from investment gains, with a 1% expense ratio costing $1,000 annually on a $100,000 portfolio. These costs compound significantly over time, with high-fee mutual funds and ETFs potentially eroding 20-30% of total returns over decades, making low-cost index funds increasingly popular among institutional investors seeking enhanced long-term performance.
Key KPIs for real-time portfolio adjustments include value-at-risk (VaR), portfolio beta, tracking error, Sharpe ratio, maximum drawdown, and sector allocation drift. These metrics enable portfolio managers to identify risk exposures, performance deviations, and rebalancing opportunities instantly, with investment firms finding that real-time monitoring significantly enhances risk management and delivers more responsive portfolio optimization.
Benchmarking enhances KPI relevance in finance portfolio management by providing industry standards for performance comparison, identifying best practices from top-performing portfolios, and establishing realistic targets aligned with market conditions. Through comparative analysis against peer portfolios and market indices, investment managers can calibrate their metrics more effectively, spot performance gaps, and optimize asset allocation strategies, ultimately delivering superior risk-adjusted returns.
When setting KPIs for alternative investments, consider risk-adjusted returns, liquidity constraints, time horizons, benchmark comparisons, and due diligence metrics. These factors enable portfolio managers to evaluate performance across private equity, hedge funds, and real estate investments, while accounting for illiquidity premiums and longer investment cycles, ultimately delivering more accurate performance assessment.
Software tools enhance finance portfolio management KPI tracking by automating data collection, providing real-time analytics, and generating comprehensive dashboards with customizable metrics. These platforms streamline performance monitoring across asset classes, risk assessment, and compliance reporting, while enabling portfolio managers to identify trends, optimize allocations, and deliver faster investment decisions, ultimately improving client outcomes and operational efficiency.
Tracking volatility as a KPI enables portfolio managers to measure investment risk, assess market uncertainty, and make informed asset allocation decisions that align with client risk tolerance. Through volatility monitoring, financial institutions can optimize diversification strategies, adjust position sizing, and enhance risk-adjusted returns, with many investment firms finding that consistent volatility tracking ultimately delivers more stable portfolio performance and stronger client relationships.
Investor goals directly determine KPI selection by aligning metrics with specific objectives like growth, income, or risk management, requiring different measures such as total return, dividend yield, or volatility ratios. Growth-focused investors prioritize capital appreciation metrics and sector performance indicators, while income-oriented investors emphasize yield consistency and distribution sustainability, ultimately ensuring portfolio monitoring matches strategic investment intentions.
Macroeconomic indicators inform finance portfolio KPIs by providing essential context for risk assessment, asset allocation decisions, and performance benchmarking against broader economic conditions. Through indicators like inflation rates, GDP growth, and interest rate trends, portfolio managers can adjust diversification strategies, rebalance sector weightings, and optimize risk-adjusted returns, ultimately delivering more resilient investment outcomes in an increasingly volatile market environment.
The time frame for evaluating portfolio management KPIs should align with investment objectives, asset classes, and market volatility, with short-term metrics reviewed monthly or quarterly, while long-term performance indicators require annual or multi-year assessments. Strategic portfolio managers increasingly use rolling periods and benchmark comparisons to capture market cycles, ultimately delivering more accurate performance insights and enabling timely rebalancing decisions across diverse investment horizons.
Best practices for reporting finance portfolio management KPIs include creating standardized dashboards, establishing regular reporting cadences, tailoring metrics to audience needs, providing contextual commentary, and ensuring data accuracy through automated systems. These approaches enhance transparency and decision-making by delivering clear performance insights, highlighting portfolio trends, and enabling stakeholders to quickly assess risk-adjusted returns, ultimately strengthening investor confidence and strategic alignment.
-
Illustrative design with editable content. Exceptional value for money. Highly pleased with the product.
-
Editable templates with innovative design and color combination.
-
Excellent products for quick understanding.
-
Design layout is very impressive.
-
Use of different colors is good. It's simple and attractive.
-
It saves your time and decrease your efforts in half.
-
Attractive design and informative presentation.
-
Good research work and creative work done on every template.
-
Easily Editable.
-
The content is very helpful from business point of view.