


Supply chain management dashboard powerpoint presentation with slides





Try Before you Buy Download Free Sample Product
 Impress Your
 Audience
 100%
100% Editable
 Save Hours
 of Time


Supply chain management is undeniably more than just a crucial facet for a successful business. Make a striking statement with our exceptionally modern and futuristic Supply Chain Management (SCM) Dashboard PowerPoint Complete Deck. From exemplifying to your team as well as the audience about the overview of whole process and stages involved to bringing into limelight lesser known specifics; the PPT presentation model on logistics will take your show to the next level. Apart from proffering insights, each and every aspect of supply chain management is epitomised with remarkable PowerPoint diagrams and graphics best adopted as per market requirements. Not only this! Our king sized deck with professionally competent PPT templates is well equipped with customer service performance and its monitoring, sales and demand forecasting, distribution strategy, SCM processes and operations, quality management and cash flow optimisation. What is most remarkable about the Presentation info graphic is that additional templates are provided with bar chart, jigsaw puzzle, newspaper clippings and dart game graphics which make sure that you hit the right target at right time. Simply click on the download link to own the stage. Guide their growth with our supply chain management ppt Deck. Empower them to achieve their goals.
People who downloaded this PowerPoint presentation also viewed the following :
Content of this Powerpoint Presentation
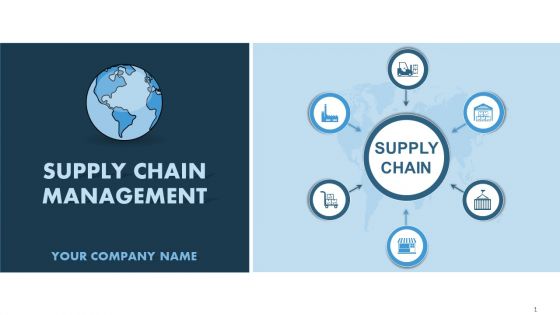
Slide 1: This slide introduces Supply Chain Management. State Your Company Name and get started.
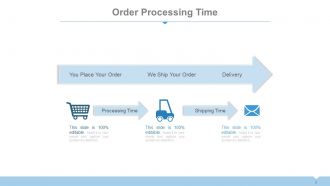
Slide 2: This slide shows Order Processing Time displaying- Shipping Time, Delivery, You Place Your Order, We Ship Your Order.
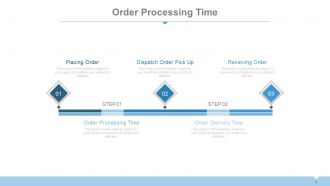
Slide 3: This slide showcases Order Processing Time with- Placing Order, Dispatch Order Pick Up, Receiving Order, Order Processing Time, Order Delivery Time.
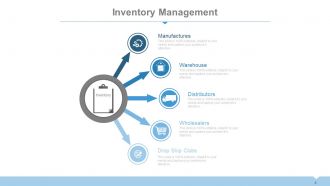
Slide 4: This slide showcases Inventory Management showing- Manufacturers, Warehouse, Distributors, Wholesalers, Drop Ship Clubs.
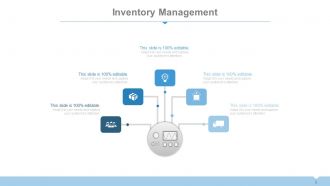
Slide 5: This slide presents Inventory Management with icon imagery.
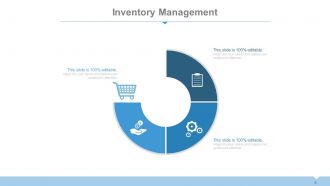
Slide 6: This slide also presents Inventory Management with icon imagery.
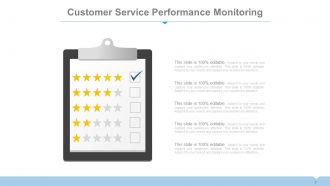
Slide 7: This slide shows Customer Service Performance Monitoring with a creative starboard imagery.
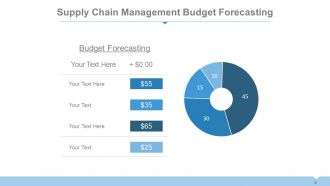
Slide 8: This slide displays Supply Chain Management Budget Forecasting in table and chart form.
Slide 9: This slide showcases Demand Forecasting graph showing- Dynamic Demand, Stable Demand, Trend in terms of Demand Quantity and Months.
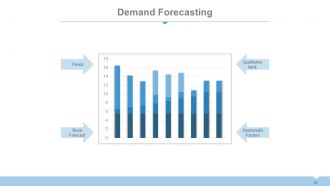
Slide 10: This slide presents Demand Forecasting with- Trends, Qualitative Input, Seasonality Factors, Base Forecast.
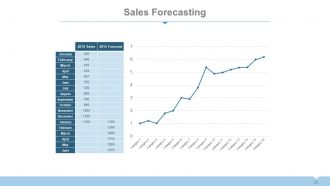
Slide 11: This is a Sales Forecasting line graph slide.
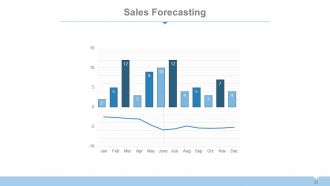
Slide 12: This is a Sales Forecasting bar graph slide.
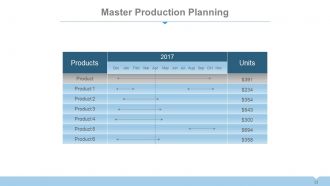
Slide 13: This slide showcases Master Production Planning in tabular form.
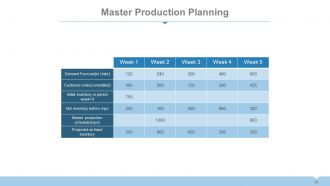
Slide 14: This slide also presents Master Production Planning in tabular form.
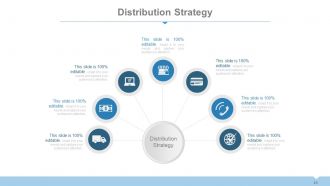
Slide 15: This slide presents Distribution Strategy to be displayed for future implementation.
Slide 16: This slide shows Operational Improvements with a creative circular imagery.
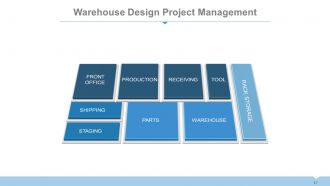
Slide 17: This slide presents Warehouse Design Project Management with the following- RACK STORAGE, FRONT OFFICE, TOOL, PRODUCTION, RECEIVING, WAREHOUSE, PARTS, STAGING, SHIPPING
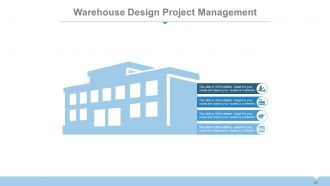
Slide 18: This slide presents Warehouse Design Project Management with a creative storage building imagery.
Slide 19: This slide shows Customer Service Focus displaying- Marketing Automation, Sales Force Automation, Financial System Integration, Customer Service Automation.
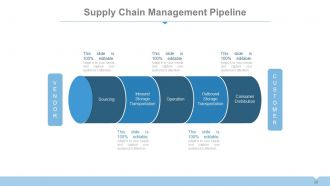
Slide 20: This slide presents Supply Chain Management Pipeline showing- Inbound Storage Transportation, Sourcing, Operations, Outbound Storage Transportation, Consumer Distribution, Vendor, Customer.
Slide 21: This slide showcases Order Fulfillment Process.
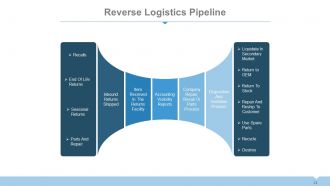
Slide 22: This slide presents Reverse Logistics Pipeline showing- Item Received In The Returns Facility, Company Repair, Recall Or Parts Process, Accounting Visibility Reports, Inbound Returns Shipped, Disposition And Sortation Process, Recalls, End Of Life Returns, Seasonal Returns, Parts And Repair, Return To Stock, Return to OEM, Liquidate In Secondary Market, Repair And Reship To Customer, Use Spare Parts, Recycle, Destroy.
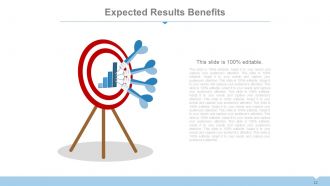
Slide 23: This slide presents Expected Results Benefits in target imagery form. State benefits etc. here.
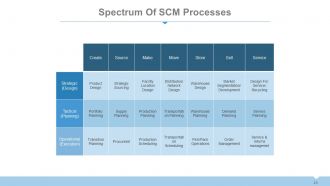
Slide 24: This slide showcases Spectrum Of SCM Processes in tabular form.
Slide 25: This slide presents Supply Chain and Operations displaying- Strategy, Operating Model, Supply Chain Network, Resilience, Tax Effectiveness, Operational Excellence, Cost To Serve, Working Capital, Performance & Analytics, Tax Risk Supply Chain Planning, Sourcing & Procurement, Operations, Logistics & Distribution.
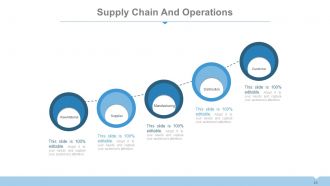
Slide 26: This slide shows Supply Chain and Operations with the following points- Customer, Raw Material, Supplier, Manufacturing, Distribution.
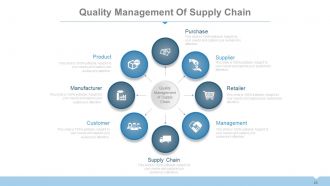
Slide 27: This slide showcases Quality Management of Supply Chain with the following points- Retailer, Purchase, Management, Supplier, Supply chain, Customer, Manufacturer, Product.
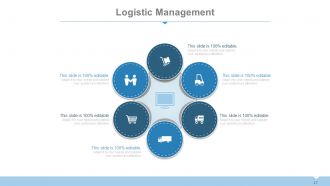
Slide 28: This slide displays Logistic management with creative icon imagery to go with.
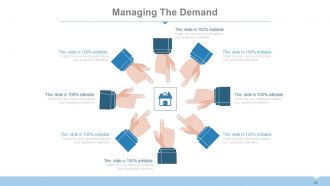
Slide 29: This slide shows Managing the Demand. State demand managing aspects etc. here.
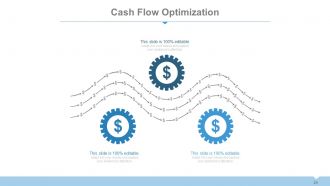
Slide 30: This slide displays Cash Flow Optimization in a creative dollar imagery form.
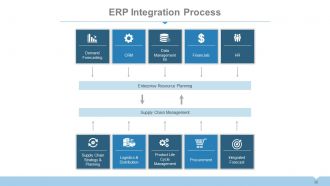
Slide 31: This slide shows ERP Integration Process displaying- Supply Chain Management: Supply Chain Strategy & Planning, Logistics & Distribution, Product Life Cycle Management, Procurement, Integrated Forecast. Enterprise Resource Planning: CRM, Data Management BI, Financials, HR, Demand Forecasting.
Slide 32: This slide is titled Additional slides. You can change the slide content as per need.
Slide 33: This is a Newspaper slide to show important information etc. You may alter the slide content as per need.
Slide 34: This is a Puzzle image slide. State information, specifications etc. here.
Slide 35: This is a Target image slide. State your targets, goals etc. here.
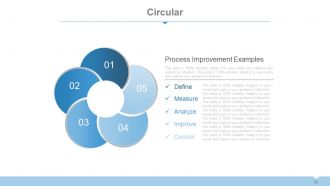
Slide 36: This is a Circular image slide. State information, specifications etc. here.
Slide 37: This is a Venn diagram image slide. State information, specifications etc. here.
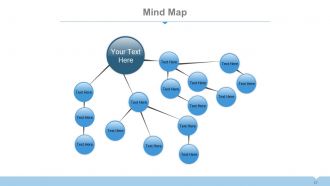
Slide 38: This is a Mind Map image slide to show information, segregation, specifications etc.
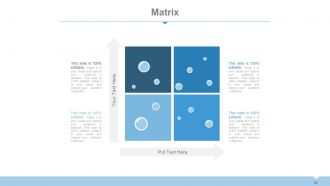
Slide 39: This slide presents a Low High Matrix for representing an information or specification.
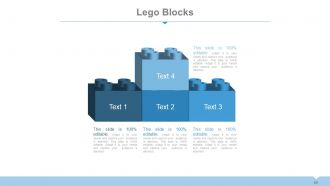
Slide 40: This is a Lego Blocks image slide with text boxes to show information, specifications etc.
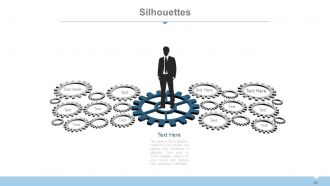
Slide 41: This slide presents Silhouettes with text boxes. State people related information, specifications etc. here.
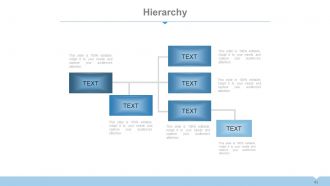
Slide 42: This is a Hierarchy slide with text boxes to show information, organization/team specifications etc.
Slide 43: This is a Bulb or Idea slide to state a new idea or highlight innovative specifications/information etc.
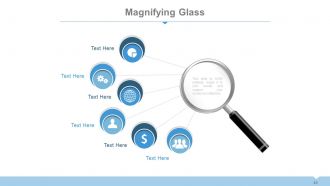
Slide 44: This is a Magnifying Glass image slide to show information, specifications etc.
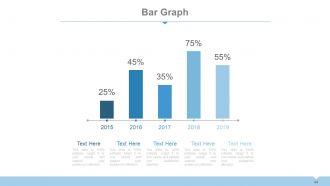
Slide 45: This is a Bar Graph slide to show product/entity comparison, specifications etc.
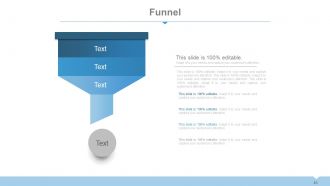
Slide 46: This slide displays a Funnel image. State information, funneling aspects etc. here.
Slide 47: This is a Thank You slide with social media handles.
Supply chain management dashboard powerpoint presentation with slides with all 46 slides:
Give a boost to burning desires with our Supply Chain Management Dashboard Powerpoint Complete Deck. They fan the flames of ambition.






FAQs for Supply chain management dashboard powerpoint
So for your supply chain dashboard, I'd start with inventory stuff - turnover rates, how often you're running out of things. Because honestly, nothing pisses off customers more than "sorry, we're out of stock." Then add delivery metrics like on-time rates and how long orders take. Cost tracking is huge too - procurement, shipping, all that. Oh and definitely include supplier performance. Lead times, quality scores, the works. These four areas will cover your basics. You can get fancy later once everyone's actually using the thing and comfortable with the data.
Dude, visualization is a game changer for supply chain stuff. You know how painful it is scrolling through endless spreadsheet rows? This gives you instant visual clues instead - heat maps showing where delays are piling up, trend lines for seasonal patterns, all that good stuff. Real-time dashboards catch problems before they explode into disasters. Way easier than digging through reports! Set up alerts for your most critical metrics so you'll get pinged when things go sideways. I swear it's like the difference between reading a manual and actually seeing what's broken.
Tableau and Power BI are probably your best bets - both handle complex data pretty well and integrate with most ERP systems. QlikView's decent too. There are specialized options like Kinaxis RapidResponse if you want something built specifically for supply chain stuff, but honestly? Power BI's hard to beat if you're already using Microsoft tools since it works seamlessly with Excel. Google Data Studio could work for simpler setups. I'd just trial Power BI and Tableau first - see which one your team actually likes using. Oracle SCM Cloud has dashboards too but feels a bit overkill unless you're already in their ecosystem.
Your system grabs data every 15 minutes from ERP, WMS, and supplier APIs, then checks it against historical patterns for weird stuff. Automated validation rules catch inconsistencies right when they pop up on your dashboard. You'll get instant alerts if inventory levels or shipment statuses look off. There are backup data sources too - honestly, the last thing you want is explaining bad numbers to leadership during a shortage crisis. My advice? Set up those validation rules first, then check your data source health daily. Catches problems before they snowball into bigger headaches.
So predictive analytics is basically your crystal ball for supply chain stuff - takes your old data and spots patterns to forecast demand and catch problems early. Your dashboard will ping you about supplier delays or when you're running low on materials. Way better than constantly putting out fires, honestly. You can actually plan ahead instead of scrambling. I'd start with your most critical products first since that's where you'll see the biggest wins. Plus seasonal spikes won't catch you off guard anymore.
Honestly, just think about what each team actually looks at day-to-day. Procurement cares about supplier stuff and costs. Operations? They want inventory numbers and production schedules. Sales teams are obsessed with forecasts and order tracking - they don't give a damn about warehouse metrics. Set up different filtered views for each role using permissions so people only see what matters to them. Otherwise you'll have everyone drowning in data they'll never use. Map out the decisions each team makes regularly, then build dashboards around that. Way more useful than cramming everything into one view.
Data inconsistencies are gonna be your worst nightmare - your ERP stores dates one way, warehouse system does it totally different. Vendors? Don't even get me started on their shipment formats. API limits will slow you down, and legacy systems are just stubborn. They weren't made for modern dashboards, honestly. Some data sources are clean, others are complete trash. Real-time syncing is another headache. Map out everything first, find the messiest connections, then fix them piece by piece. Oh, and prepare for way more coffee than usual.
So dashboards basically show you where stuff gets stuck in real-time. You can see processing times, inventory piling up, throughput rates - all that good stuff. When one section takes way longer than the others or queues start building up, boom, there's your problem. Way easier to catch than staring at endless spreadsheets (been there, done that). The visual thing really helps patterns jump out at you. Oh, and definitely set alerts for when things hit certain levels - saves you from putting out fires later when everything's already backed up.
Track the obvious stuff first - on-time delivery, defect rates, and whether they're sticking to agreed pricing. Lead time consistency matters too, plus fill rates (basically did they actually send everything you ordered). Responsiveness is huge when things go sideways, though that's harder to put numbers on. If you're in something regulated, compliance scores are worth tracking. Honestly, the trick is setting up alerts before these metrics tank - way better than finding out when customers start complaining. Oh, and quality scores can be rejection percentages or whatever makes sense for your stuff.
Honestly, supply chain dashboards are clutch for this stuff. Track your carbon footprint, waste reduction, energy use - all in real-time instead of drowning in Excel hell. The visual setup makes it obvious which suppliers are tanking your green goals. Set up alerts so you know immediately when emissions jump or you miss waste targets. I'd probably start with your top 3 sustainability metrics and build from there. Way easier to spot patterns when everything's laid out visually. Plus your team will actually look at dashboards vs endless spreadsheet reports.
Hey! So for mobile supply chain dashboards, responsive design is a must - buttons need to be finger-friendly and everything should resize properly. Keep layouts super simple though. Honestly, trying to fit every single metric on a phone screen is just asking for a mess. Focus on your top 3-5 things people actually check while they're out - inventory levels, delivery updates, alerts, that stuff. Swipe navigation works great for switching between views. Oh, and definitely include offline mode so cached data shows up when cell service sucks. What metrics does your team look at most?
Dude, be brutal about what actually matters to your users day-to-day. Pick maybe 3-5 KPIs that drive real decisions - inventory, delivery delays, supplier stuff - and make those pop on your main screen. I made the classic mistake of shoving 20 metrics on one dashboard and surprise, nobody touched it. Your main view should be scannable in like 30 seconds, but yeah, build those drill-down layers for when people need the nitty-gritty. Test with real users constantly - they're way better at spotting what's useful versus total fluff. Trust me on this one.
Set up weekly data audits so you catch broken connections before your team starts complaining. Business priorities change constantly in supply chain, so keep your KPIs updated accordingly. Trust me, nothing's worse than dashboards filled with useless widgets nobody cares about anymore. Get feedback from people who actually use the thing - they'll tell you what's broken. Document your changes too, because you'll totally forget why you set something up a certain way. Oh, and pick one day each week to review performance issues and user complaints. Makes it way more manageable.
Get user feedback early and often - like during wireframing, not just at the end. Test your prototypes with actual supply chain managers, because honestly, executives usually have no clue what these people need day-to-day. Skip the generic "do you like this?" questions. Instead, dig into their workflows and pain points. What data do they actually use vs. what their bosses think they should use? Those are totally different things. Set up regular check-ins after launch too. Oh, and build a simple feedback tool right into the dashboard so they can report issues on the spot.
Dude, automation has totally changed how supply chain dashboards work. Real-time data feeds mean you're seeing actual current info instead of yesterday's numbers. The predictive stuff is getting scary good too - like, it'll catch issues before they blow up. I love that you can set alerts for problems so you don't have to babysit the thing constantly. Development's way faster now since APIs just grab data from everywhere automatically. Oh, and start with your most critical data sources first. Don't try to automate everything at once or you'll go crazy.
-
Thanks for all your great templates they have saved me lots of time and accelerate my presentations. Great product, keep them up!
-
Thanks for all your great templates they have saved me lots of time and accelerate my presentations. Great product, keep them up!