


Agriculture Dashboard Powerpoint PPT Template Bundles




Try Before you Buy Download Free Sample Product
 Impress Your
 Audience
 100%
100% Editable
 Save Hours
 of Time


Our Agriculture Dashboard Powerpoint PPT Template Bundles are topically designed to provide an attractive backdrop to any subject. Use them to look like a presentation pro.
People who downloaded this PowerPoint presentation also viewed the following :
Agriculture Dashboard Powerpoint PPT Template Bundles with all 22 slides:
Use our Agriculture Dashboard Powerpoint PPT Template Bundles to effectively help you save your valuable time. They are readymade to fit into any presentation structure.







FAQs for Agriculture Dashboard Powerpoint
Track what actually matters for your daily decisions first. Soil moisture, temps, rainfall - that stuff drives when you irrigate and plant. Yield predictions and equipment status are huge too because breakdowns always hit at the worst possible moment, right? Labor costs and profit per acre obviously matter for the bigger picture. Add livestock data if you have animals. Honestly, I'd rather have a few solid metrics I actually use than tons of fancy dashboards that just eat up time. You want info that helps you make quick calls, not something that takes forever to digest every morning.
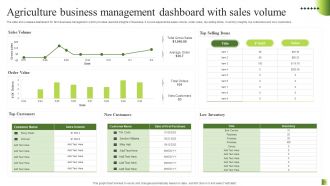
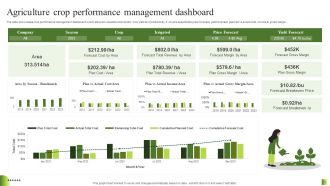
Honestly, visualization beats staring at endless spreadsheets any day. You'll spot irrigation issues or pest problems way before they blow up into expensive disasters. The dashboards make trends super obvious - like when your soil moisture's dropping or which fields are actually profitable. I started with just tracking my biggest headaches (yields and water usage for me), then built from there. Game changer doesn't even cover it. Now I can adjust planting schedules based on actual data instead of just guessing. Figure out what decisions stress you out most, then make charts for those specific things.
Weather data is literally what makes your whole agriculture dashboard work. Real-time forecasts and historical patterns drive everything - crop growth predictions, when to irrigate, pest outbreaks, yield estimates. It's wild how connected it all is, honestly. Your dashboard uses this info to help with planting decisions and resource planning. Oh, and make sure your weather sources are actually reliable and updating regularly - I learned that the hard way with a project last year. Without solid weather integration, you're basically flying blind on most agricultural insights.
So you can hook up IoT sensors straight to your dashboard using APIs or MQTT - soil moisture, temperature, all that stuff gets beamed wirelessly to show live data. Pretty wild how smooth it works now. Your dashboard turns it into charts and sends alerts when things go sideways. I'd honestly start with just soil moisture sensors though, way better bang for your buck and you'll actually use that data right away. Get your connectivity solid first, then you can always throw more sensors at it later. The real-time aspect is a game changer for catching issues early.
Honestly, keep it stupid simple - farmers need to catch problems fast, not dig through menus. Big, clear charts for weather and crop health work best. Color-code everything: red screams trouble, green means you're good. Way too many dashboards try cramming everything in and become total garbage. Group stuff logically - "Field Overview," "Equipment," "Alerts" - nothing fancy. Mobile is crucial since they're actually out there using it. Oh, and test with real farmers early. They'll tell you what sucks way faster than any designer will.
Hook up your ML models to pull weather data, soil info, and past yields - then pipe those predictions straight into your dashboard. Interactive maps work great for showing yield forecasts by field. I'd also add trend charts comparing this season to previous years. Confidence intervals are crucial though - farmers need to know how reliable your predictions actually are. Alert systems help flag problem areas before they tank. The visual design honestly makes or breaks these things, so don't rush that part. Oh, and start with just one crop type first. Way easier to debug when you're not juggling corn and soybeans simultaneously.
Honestly, most ag dashboards are just data dumps. They'll show you soil moisture, weather, crop health, yield predictions - everything at once. It's a mess. What really bugs me is they don't tell you what any of it means for YOUR farm or what to actually do about it. Plus the data sources rarely sync up right, so you're getting conflicting info. My take? Skip the fancy charts and find something that gives you real insights you can act on. Customize it to show only what matters for your crops. Less noise, more signal.
Look at your past 3-5 years of data first - that's where the gold is. Your dashboard will show you which seed varieties crushed it during drought years and how planting dates messed with your harvest timing. I swear, some farmers sleep on this stuff but it's basically a cheat code for planning. Weather patterns, soil conditions, yield numbers - they all tell a story. You can nail down better seed choices, tweak when you fertilize, and even figure out staffing ahead of time. Way better than just winging it every season and hoping for the best.
Dude, responsive design is everything since farmers are literally bouncing between tractors and fields all day. GPS mapping is a must-have - seriously, how do some apps still miss this? Real-time weather, soil moisture, crop health, equipment alerts. Push notifications for the big stuff like irrigation failures. Oh, and offline mode because rural cell towers are basically a myth sometimes. Keep buttons big enough for work gloves and don't overcomplicate the interface. Touch targets need to be chunky. Start simple, then build from there based on what users actually tell you they need.
So basically these dashboards let you see all your sustainability stuff in one spot - water usage, soil health, pesticide rates, carbon footprint, whatever. Real-time data means you can actually make smart choices instead of just guessing. Mine sends alerts when I'm wasting resources or need to switch up crop rotations. Honestly the visual part makes such a difference - numbers on spreadsheets are boring but graphs actually tell you something. First step is figuring out which metrics actually matter for your farm, then find something that'll play nice with whatever management system you're already using.
Weather APIs are your best friend for rainfall and temperature data. Satellite imagery shows how your crops are actually doing - way more accurate than just eyeballing fields. IoT sensors give you real-time soil moisture and pH readings, which honestly saves so much guesswork. Market feeds are clutch since commodity prices swing like crazy. You'll want farm management software integration too, plus government databases for regulations (ugh, paperwork). Social media sentiment tracking is becoming a thing now for trend spotting. Start with weather and sensor data first - that's the bread and butter stuff.
So basically, you can use ML to predict crop yields and weather way better than old-school methods. The algorithms find crazy connections - like how soil moisture from weeks ago affects your plants today. Super nerdy but actually useful. Feed it more data from your sensors and it gets smarter over time. You'll catch pest problems early and nail your planting schedules. Honestly, irrigation optimization alone might pay for itself. I'd start small though - maybe just yield forecasting first, then add more models once you see how it works.
Your dashboard basically becomes a digital field notebook - you can log everything you spray or spread, when you did it, and exactly where. Pretty cool seeing it all mapped out on your fields afterward. Set up alerts so you don't miss reapplication windows, and it'll track your per-acre costs too. Honestly, the compliance tracking is probably the biggest lifesaver - nobody wants to scramble for records during an inspection. Plus when you're planning next season, all that data's right there waiting for you.
So it's basically a shared platform where local farmers can post real-time updates on their crops, weather, and what resources they've got available. Everyone makes smarter decisions when they can see the bigger picture. You'll be able to track which techniques are actually working, coordinate who's borrowing what equipment, and time your harvests so you're not all flooding the market at once. Way better than those group text chains that turn into absolute madness - trust me on that one. Plus you can figure out who's the tomato expert or whatever and actually learn from each other. Just start small with a few reliable farmers posting consistently, then grow it out.
Honestly, start with multi-factor authentication - passwords alone are basically garbage against anyone who knows what they're doing. SSL/TLS encryption for data transmission is non-negotiable, and you should encrypt sensitive stuff when it's stored too. Role-based permissions are huge - people shouldn't see data they don't need for their job. Agriculture data is tricky because you've got financial records mixed with farming techniques that could be worth serious money. Do a quick audit of what sensitive data you're actually storing and who can access it. Regular security reviews will save your ass later.
-
It makes easy work of my work presentations. I’ve never had to be nervous about my presentations for meetings.
-
The quality of the templates is as fine as it could get. It was a purchase well made!