Can you imagine a world without food? It's THE ultimate necessity, the very essence of survival. While luxuries enrich our lives, sustenance draws the line between existence and oblivion. Behind the scenes, agribusiness companies, farmers, and stakeholders work with absolute dedication to ensure the continuous flow of food products. But have you ever wondered how they manage it all on such a grand scale? The answer lies in the heart of their operations—an inclusive Agriculture Dashboard.
Today's modern agricultural sector faces complex challenges, from fluctuating market demands to unpredictable weather patterns. Amidst these issues, the need for efficient management and decision-making in farming operations has never been greater. This is where SlideTeam’s Agriculture Dashboard Templates come into play.
An Agriculture Dashboard is a comprehensive tool for farmers, agribusiness owners, agricultural consultants, and stakeholders to monitor and manage every aspect of their farming operations. From tracking crop yields and soil moisture levels to analyzing financial metrics and equipment utilization, these dashboards provide real-time insights and actionable data for informed decision-making.
Without an Agriculture Dashboard, users may struggle with several pain points. Imagine the frustration of manually compiling scattered data from different sources, struggling to identify trends or inefficiencies in farm operations, or being blindsided by unforeseen challenges due to a lack of timely information. These inefficiencies can spell the difference between success and failure.
That's why downloading SlideTeam's Agriculture Dashboard Templates becomes a necessity. Our slides are designed to empower users with the tools they need to streamline their farming operations, optimize resource allocation, and maximize productivity. With customizable features, interactive charts, and intuitive interfaces, our templates make data visualization and analysis accessible to users of all levels.
Let's explore the templates on offer!
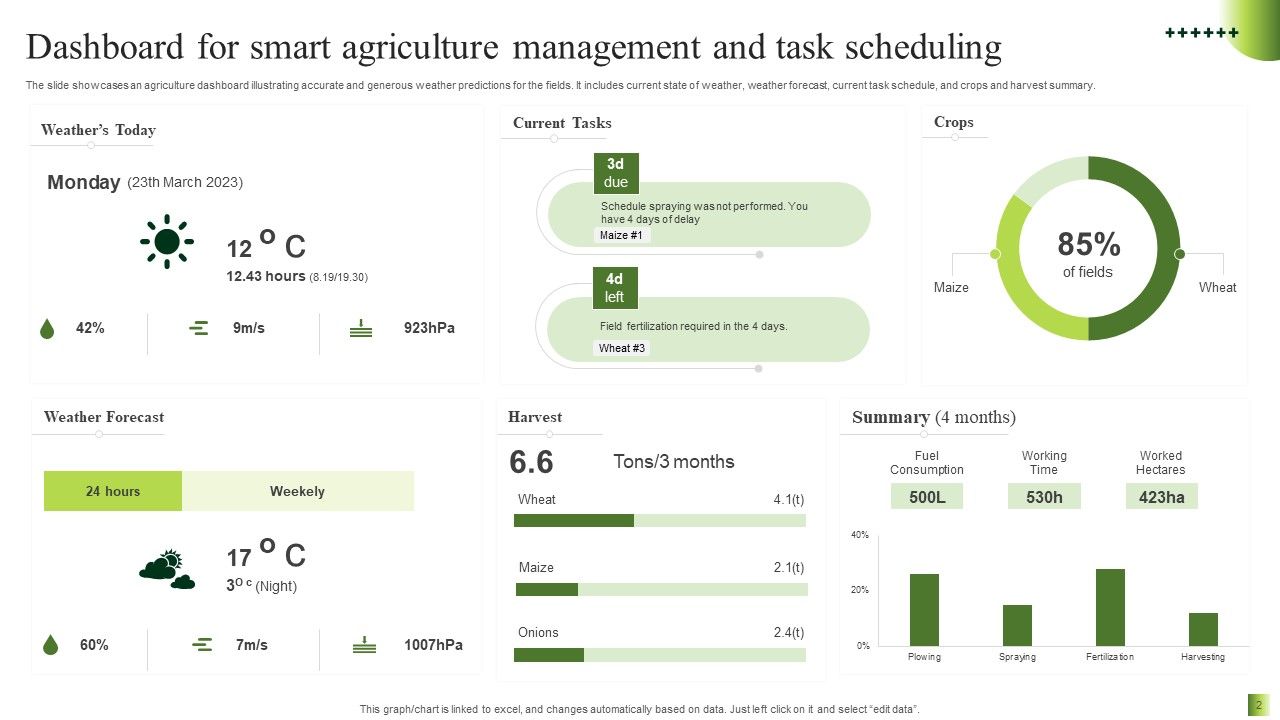
Template 1: Dashboard for Smart Agriculture Management and Task Scheduling
This PPT Dashboard offers a complete overview of key agricultural metrics. It includes real-time weather updates encompassing temperature, humidity, precipitation, and wind conditions, aiding in informed decision-making. The PPT Layout also provides a 24-hour and weekly forecast to assist in planning future activities. It features sections for tracking current tasks, monitoring crops, and managing harvest schedules. The summary section condenses four months' worth of data into actionable insights, enabling users to optimize agricultural operations. Download now!
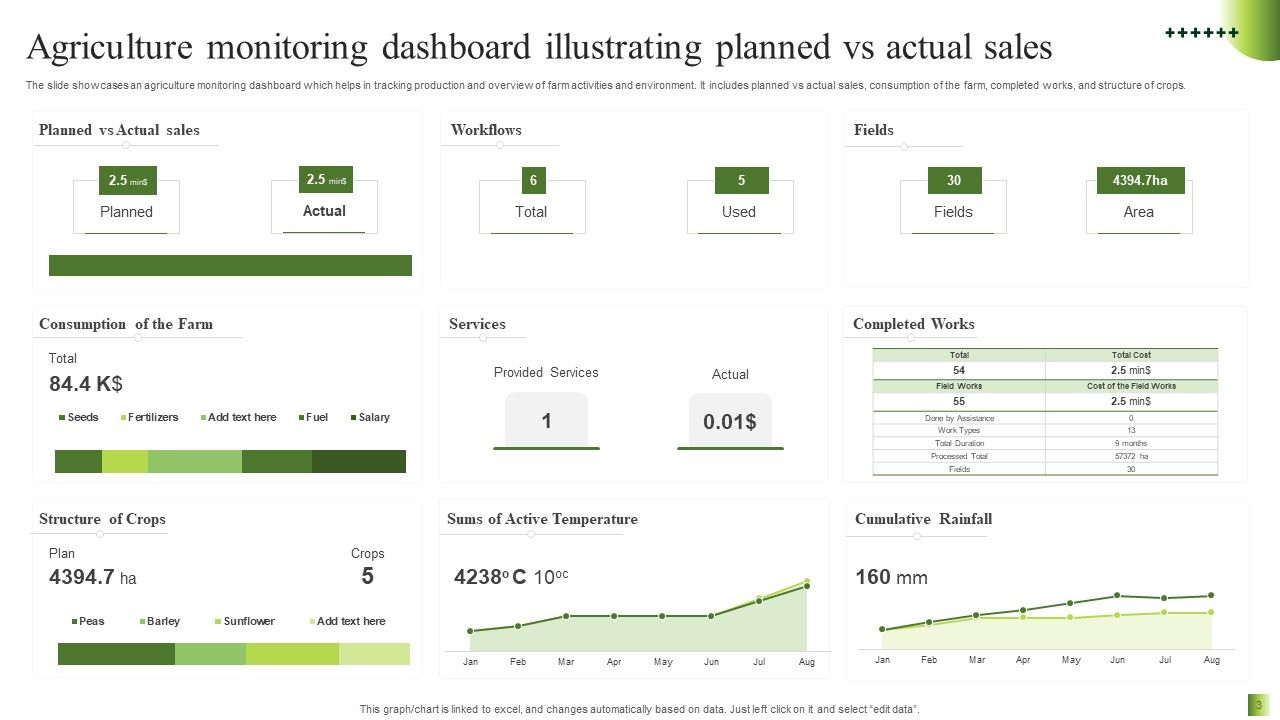
Template 2: Agriculture Monitoring Dashboard Illustrating Planned vs. Actual Sales
This PowerPoint Slide helps assess planned versus actual sales, aiding in performance analysis. It outlines workflows to streamline operations and enhance efficiency. The template also includes sections for tracking fields, offering insights into resource allocation and management. Additionally, it visualizes the consumption of the farm, facilitating inventory management and cost control. With a focus on the structure of crops, it enables users to monitor growth patterns and optimize cultivation strategies. Download now!
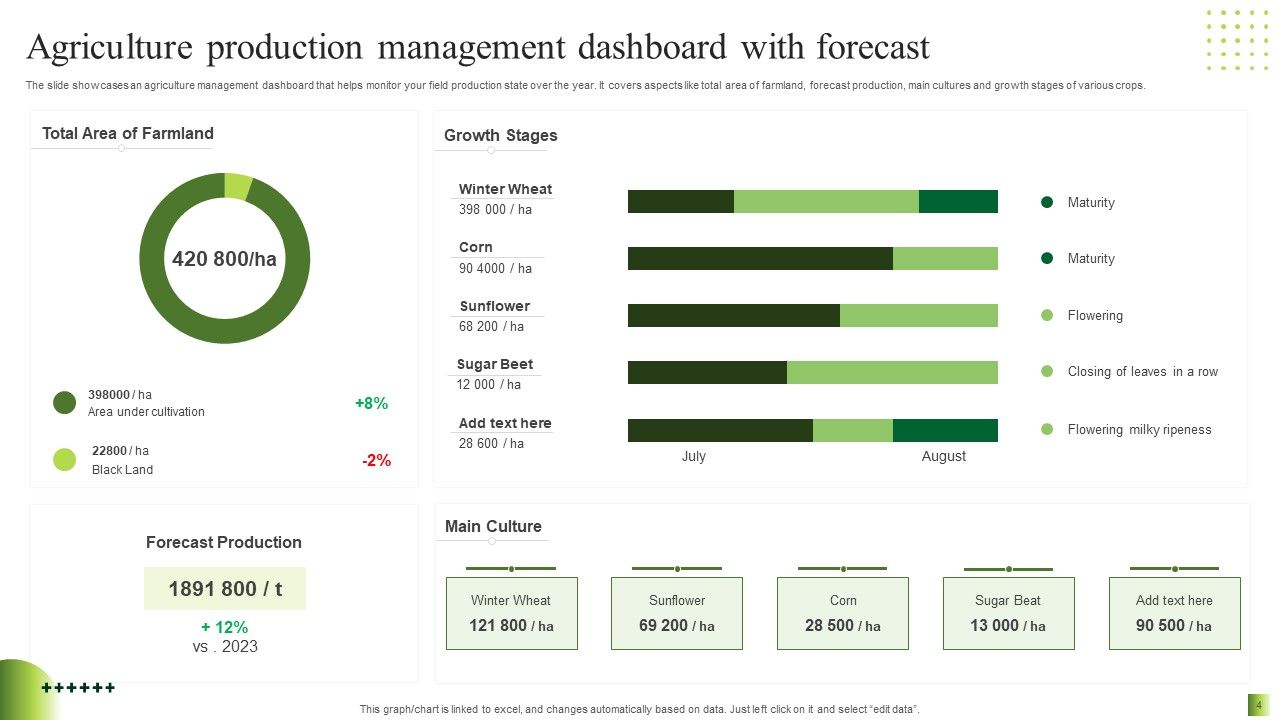
Template 3: Agriculture Production Management Dashboard with Forecast
The PPT Layout offers a quick snapshot of agricultural operations with a focus on forecasting. It presents data on the total area of farmland, providing insight into resource allocation and capacity. Additionally, the template tracks the growth stages of key crops such as winter wheat, corn, and sunflower, aiding in monitoring crop health and development. With a dedicated section for forecast production, it enables users to anticipate yields and plan accordingly. Download now!
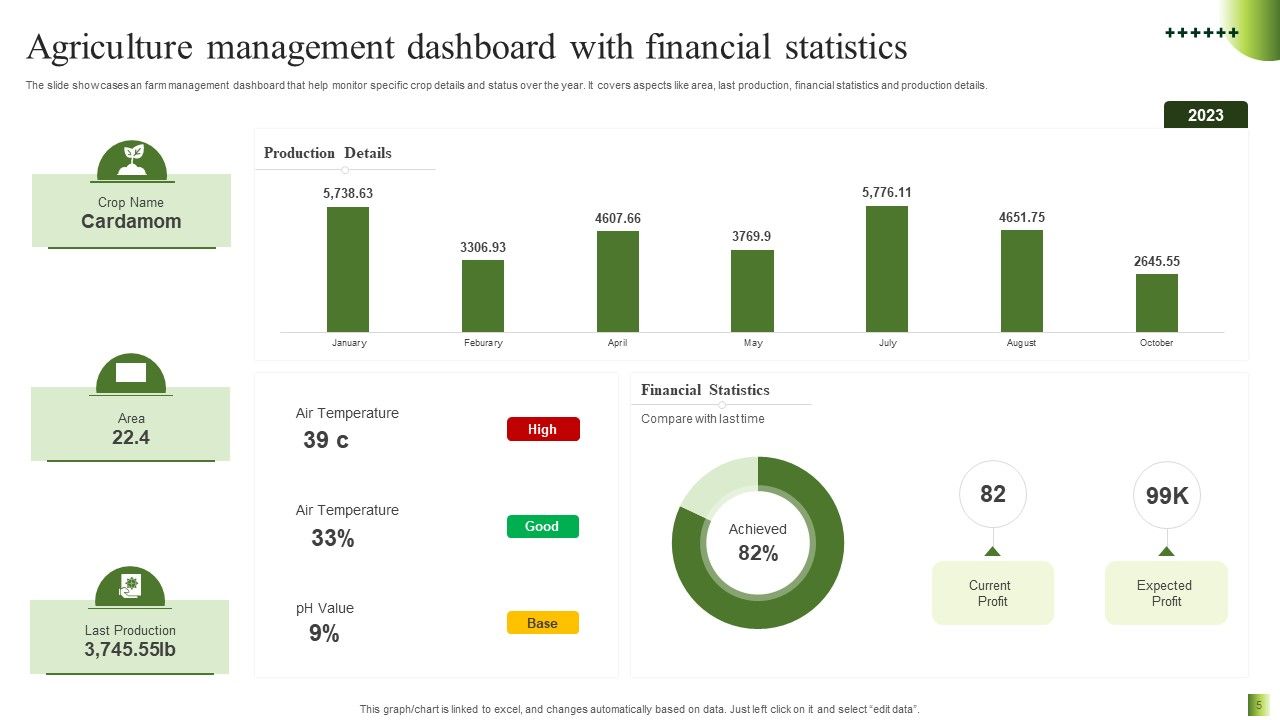
Template 4: Agriculture Management Dashboard with Financial Statistics
This PPT Set provides detailed information on crop details, including the area under cultivation and the last production figures. The production details are graphically represented over the last seven months, facilitating trend analysis and decision-making. Moreover, the inclusion of financial statistics such as current profit and expected profit empowers users to measure the financial health of their agricultural ventures. Get it today!
Template 5: Dashboard for Digital Agriculture Business Management
This PowerPoint Template provides a comprehensive toolkit for modern farming enterprises. It encompasses vital metrics such as total area, crop quantity, yield, and revenue, enhancing decision-making capabilities. With hurricane prediction features, it aids in risk mitigation and disaster preparedness. The yield overview section contrasts planned versus actual yields, enabling performance evaluation. Tasks are organized, covering essential activities from soil testing to harvest scheduling. Additionally, detailed soil information, including texture and organic matter content, offers insights into precision farming practices. Download now!
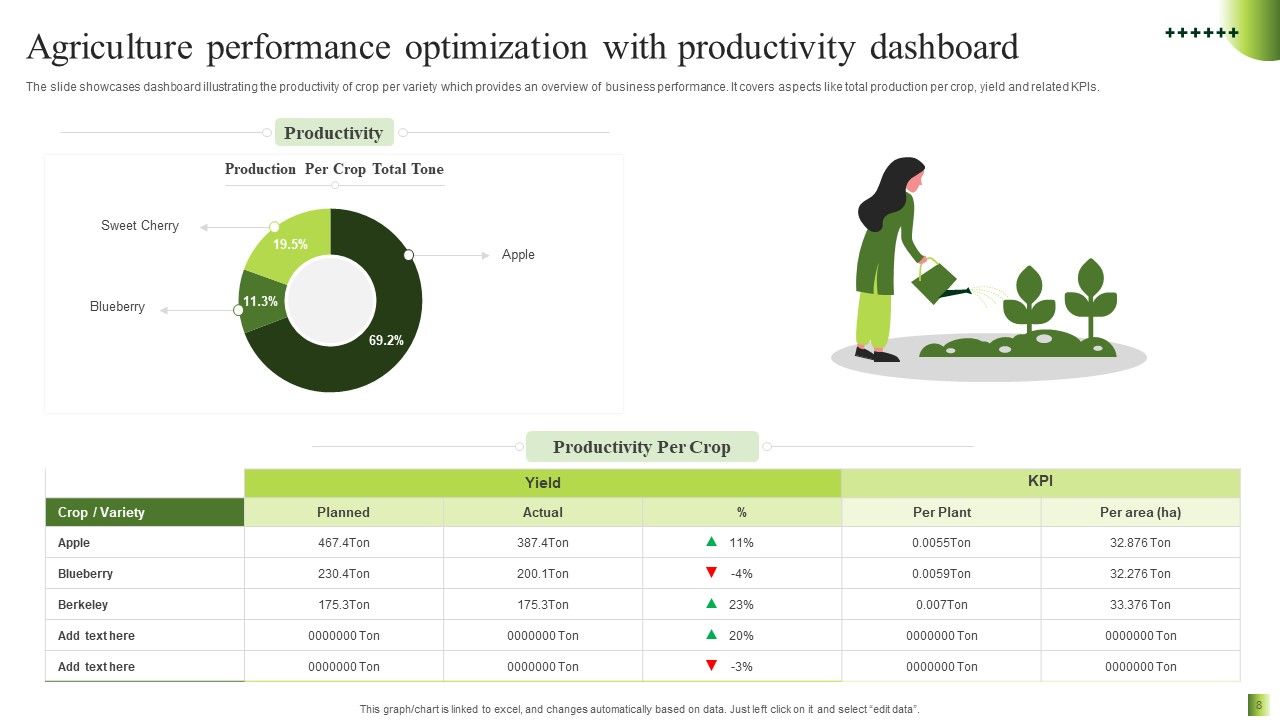
Template 6: Agriculture Performance Optimization with Productivity Dashboard
This PPT Preset is designed to maximize agricultural efficiency. It tracks productivity metrics, detailing production per crop in tons across diverse crops. The productivity per crop section provides a deeper dive, showcasing planned versus actual yield alongside percentage variances and facilitating performance analysis. Key Performance Indicators (KPIs) are presented per plant and area, offering granular insights into operational effectiveness. Download now!
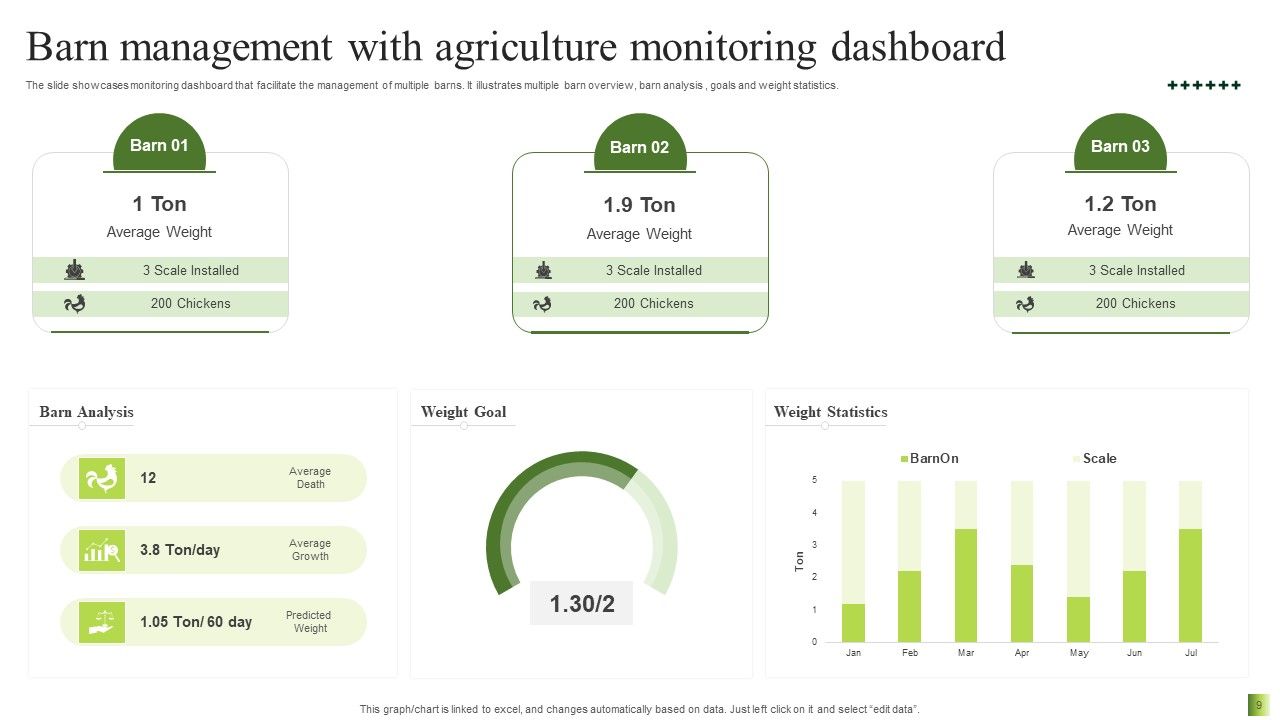
Template 7: Barn Management with Agriculture Monitoring Dashboard
This PowerPoint Slide offers insights into livestock management and barn operations. It allows for the efficient management of up to three barns, showcasing key metrics such as average weight, installed scales, and chicken population per barn. The barn analysis section provides in-depth insights into performance metrics, including average death and growth rates, aiding in optimization strategies. Weight statistics are graphically represented, providing visual clarity on weight trends. Download now!
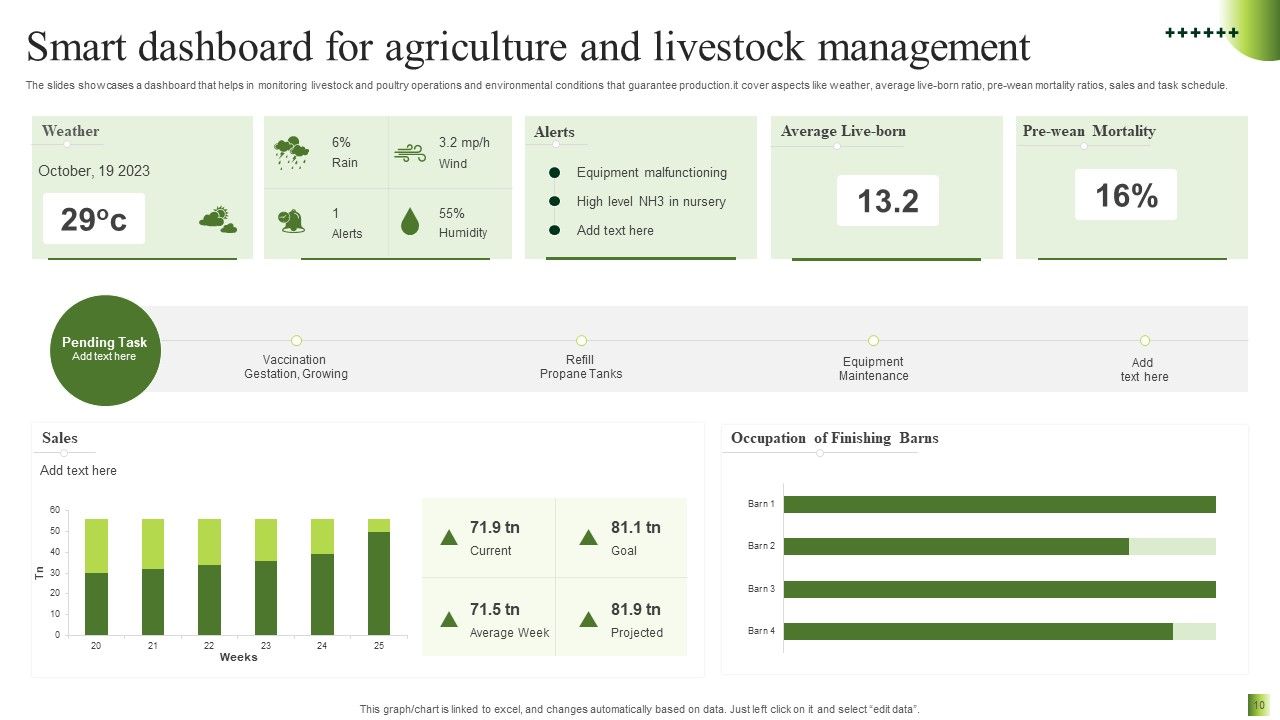
Template 8: Smart Dashboard for Agriculture and Livestock Management
This PPT Framework offers a quick solution for monitoring and optimizing farming and livestock operations. It provides real-time weather updates, including temperature, rainfall, wind, and humidity, enabling informed decision-making. The 'alerts' feature notifies users of equipment malfunctions and other critical issues, ensuring timely intervention. Livestock-related metrics such as average live-born and pre-wean mortality rates are tracked, facilitating health management. The pending task section streamlines operational workflows by highlighting essential tasks like vaccination and equipment maintenance. Additionally, sales data is presented visually through bar graphs, allowing for quick analysis of revenue trends. Download now!
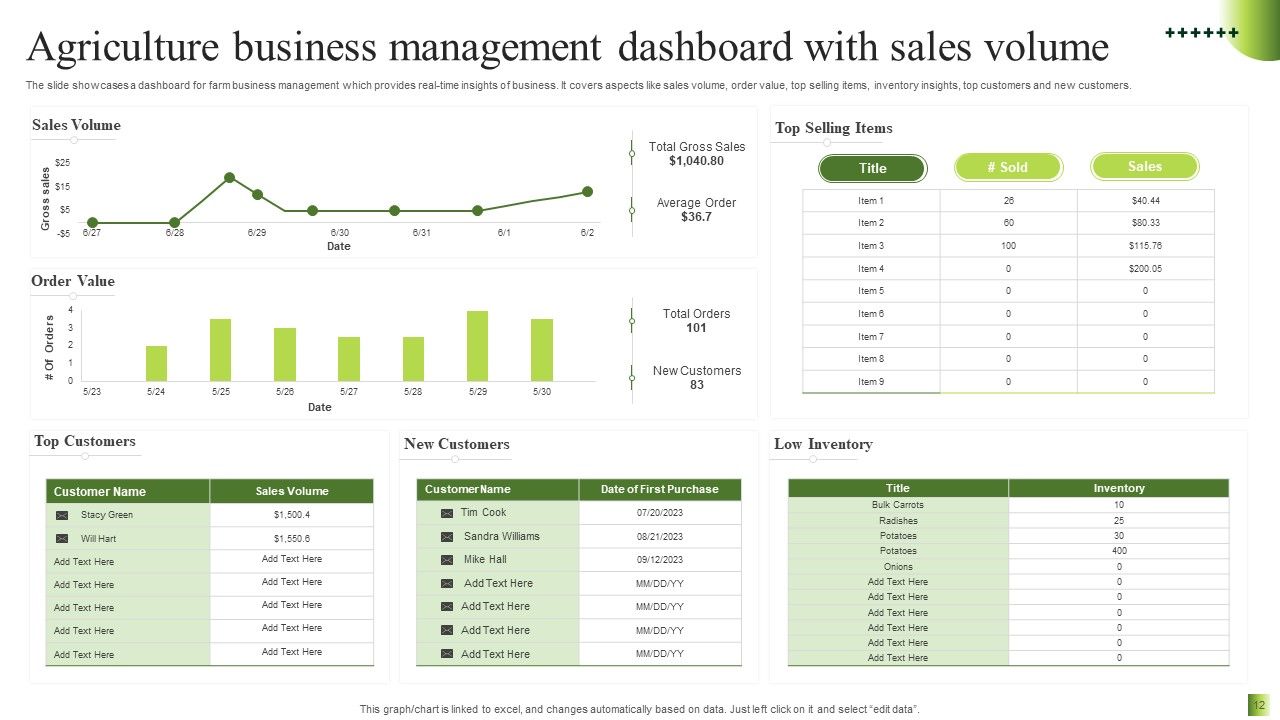
Template 9: Agriculture Business Management Dashboard with Sales Volume
This PPT Slide helps evaluate sales performance and customer insights. It visually presents sales volume over time through a gross sales graph, aiding in trend analysis and forecasting. The top-selling items section highlights essential products driving revenue growth. Order value is depicted on a bar graph, allowing for easy comparison and analysis. Additionally, the dashboard identifies top customers and new customer acquisitions, enabling targeted marketing strategies. Low inventory details ensure proactive inventory management, optimizing stock levels. Download now!
Template 10: Agriculture Crop Performance Management Dashboard
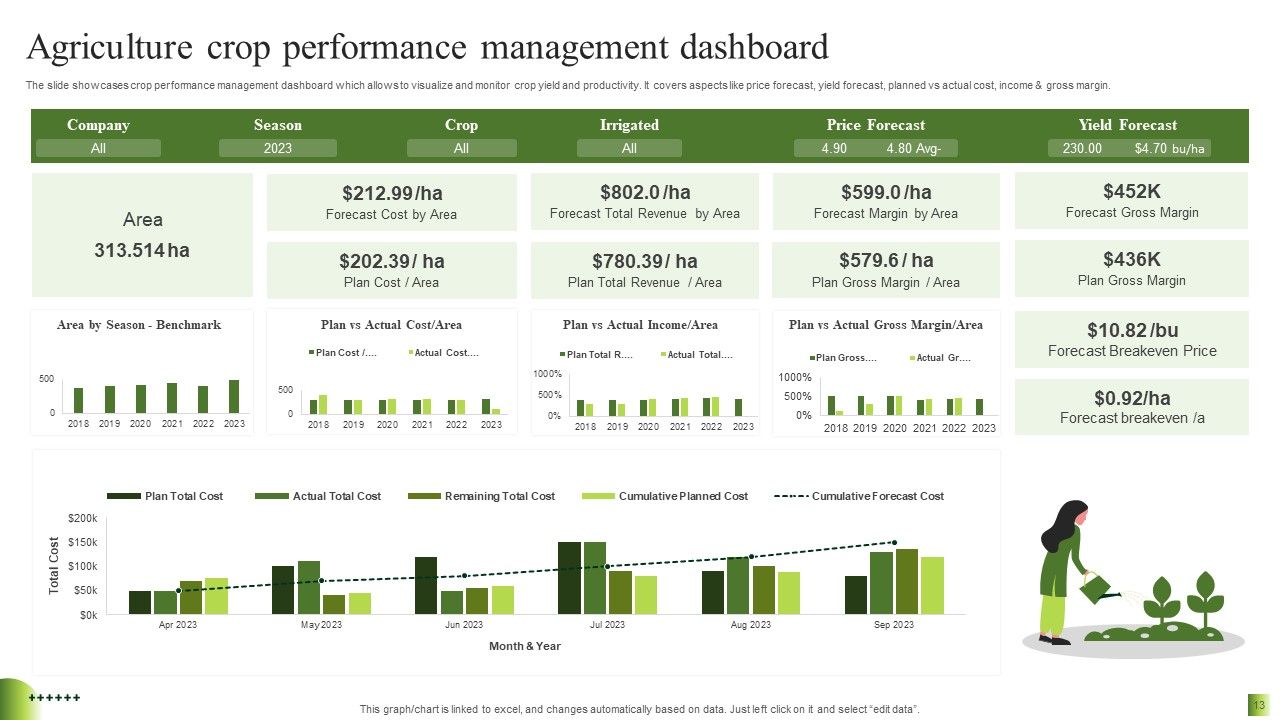
This PPT Set provides a relevant platform for monitoring and optimizing crop performance. It features detailed sections for tracking different crops, irrigation status, price forecasts, and yield predictions, facilitating informed decision-making. Graphical representations comparing planned versus actual cost per area, income per area, and gross margin per area offer insights into financial performance and efficiency. Download now!
Rooted in Data: Thriving in the Modern Agricultural Landscape
The world of agriculture is not just about planting seeds and harvesting crops—it's a complex ecosystem where data-driven decision-making is the key to success (our survival). As we've explored the significance of Agriculture Dashboard Templates, it's clear that these tools are a must-have for modern farmers, agribusiness owners, and stakeholders.
Employing these ensures users gain real-time insights into their farming operations, enabling them to make informed decisions that drive productivity and profitability. From monitoring crop health to optimizing resource allocation, these templates offer a holistic approach to farm management that is essential in today's sensitive agricultural landscape. Get them today!




 Customer Reviews

