


Telecom Dashboard Powerpoint PPT Template Bundles





Try Before you Buy Download Free Sample Product
 Impress Your
 Audience
 100%
100% Editable
 Save Hours
 of Time


Our Telecom Dashboard Powerpoint PPT Template Bundles are topically designed to provide an attractive backdrop to any subject. Use them to look like a presentation pro.
People who downloaded this PowerPoint presentation also viewed the following :
Telecom Dashboard Powerpoint PPT Template Bundles with all 19 slides:
Use our Telecom Dashboard Powerpoint PPT Template Bundles to effectively help you save your valuable time. They are readymade to fit into any presentation structure.







FAQs for Telecom Dashboard Powerpoint
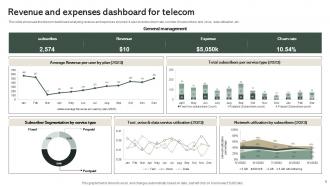
Effective telecom dashboards should include network performance metrics like latency, throughput, and uptime, customer experience indicators such as call drop rates and service quality scores, revenue metrics including ARPU and churn rates, and operational efficiency measures. These KPIs enable telecom operators to monitor network health, optimize customer satisfaction, and drive strategic decision-making, ultimately delivering improved service reliability and competitive advantage.
Telecom dashboards can be customized through role-based access controls, configurable KPI widgets, personalized alert thresholds, and stakeholder-specific visualization formats. Network engineers access technical performance metrics, executives view revenue and customer satisfaction summaries, while customer service teams monitor real-time service disruptions, ultimately enabling targeted decision-making across organizational levels.
Real-time data enables telecom operators to make immediate, informed decisions by providing instant visibility into network performance, customer behavior, traffic patterns, and system anomalies. Through live analytics dashboards, operators can quickly identify congestion hotspots, optimize resource allocation, and proactively address service disruptions, ultimately delivering improved customer experiences and enhanced operational efficiency.
Visual analytics transforms complex telecom data into intuitive charts, graphs, heatmaps, and interactive dashboards that reveal patterns, trends, and anomalies at a glance. Through strategic data visualization, telecom operators can streamline network performance monitoring, enhance customer experience analysis, and accelerate decision-making processes, ultimately delivering faster problem resolution and improved operational efficiency across increasingly complex network infrastructures.
Best practices for designing intuitive telecom dashboard layouts include logical information hierarchy, consistent visual elements, customizable widgets, real-time data integration, and mobile responsiveness. These design principles streamline network monitoring by reducing cognitive load, enabling faster decision-making, and enhancing operational efficiency, with many telecom operators finding that well-structured dashboards significantly improve incident response times and overall network performance management.
Telecom dashboards integrate with business intelligence tools through APIs, data connectors, and ETL processes that enable seamless data exchange across platforms like Tableau, Power BI, and SAP Analytics. These integrations streamline operations by consolidating network performance, customer analytics, and financial metrics, ultimately delivering comprehensive insights that enhance decision-making and competitive advantage.
Challenges include data silos across network systems, real-time synchronization issues, inconsistent data formats from multiple vendors, network latency affecting updates, and integration complexities between legacy and modern infrastructure. These obstacles can compromise decision-making accuracy, with many telecom operators finding that automated data validation processes and centralized data governance frameworks significantly enhance dashboard reliability and operational confidence.
Machine learning enhances telecom dashboards by analyzing network traffic patterns, customer usage behaviors, and equipment performance data to forecast potential outages, capacity needs, and churn risks. Through predictive algorithms, telecom operators can proactively address network congestion, optimize resource allocation, and improve service reliability, ultimately delivering enhanced customer experiences and operational efficiency.
Telecom dashboard security requires multi-factor authentication, role-based access controls, end-to-end encryption, real-time threat monitoring, and secure API gateways to protect customer data and network information. These measures streamline compliance with regulations like GDPR while enabling telecom operators to maintain operational transparency, ultimately delivering enhanced customer trust and competitive advantage in an increasingly data-sensitive marketplace.
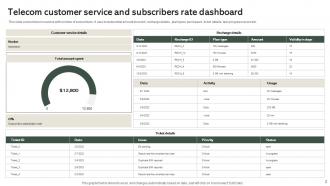
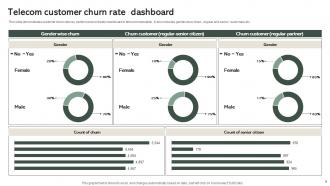
Telecom dashboards help monitor customer satisfaction and churn rates by providing real-time analytics on service quality metrics, customer feedback scores, usage patterns, billing disputes, and support ticket volumes. These comprehensive tools enable telecom operators to identify at-risk customers early, proactively address service issues, and implement targeted retention strategies, ultimately reducing churn rates and enhancing customer experiences.
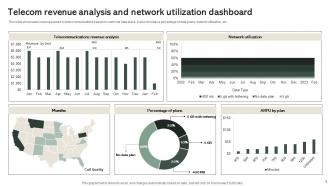
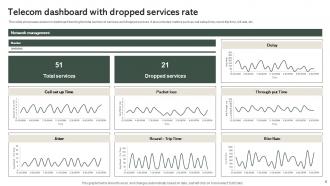
Common visualization techniques for telecom call data include heat maps, line charts, bar graphs, network topology diagrams, and real-time meters. These visualizations streamline network monitoring by displaying call volumes, traffic patterns, and performance metrics across different time periods and geographic regions, with many telecom operators finding that combined dashboards enhance operational efficiency and enable faster identification of network bottlenecks.
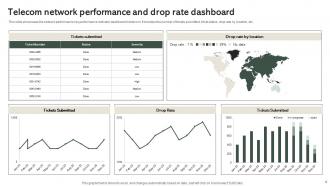
Dashboards facilitate better network performance management by providing real-time visibility into network metrics, automated alert systems, and predictive analytics capabilities. Through centralized monitoring platforms, telecom operators can quickly identify bottlenecks, optimize bandwidth allocation, and proactively address service disruptions, ultimately delivering improved customer experiences and enhanced operational efficiency across their infrastructure.
Key metrics for telecom marketing campaign effectiveness include customer acquisition cost, conversion rates, lifetime value, churn reduction, brand awareness scores, and return on advertising spend. These metrics enable telecom companies to optimize their marketing investments across digital channels, direct mail, and retail partnerships, while many operators find that tracking engagement metrics alongside retention rates delivers deeper insights into campaign performance and competitive positioning.
Telecom dashboards assist in regulatory compliance reporting by automating data collection, standardizing report formats, and providing real-time monitoring of compliance metrics across network operations. These platforms streamline audit trails, enhance data accuracy, and deliver comprehensive reporting capabilities, with telecommunications companies finding that automated compliance dashboards significantly reduce manual reporting errors while ensuring timely regulatory submissions and maintaining transparent oversight.
User feedback is crucial for telecom dashboard redesign because it reveals actual usage patterns, identifies pain points in network monitoring workflows, and highlights missing functionality that impacts operational efficiency. Through comprehensive feedback analysis, telecom operators can streamline interface design, enhance data visualization clarity, and optimize alert management systems, ultimately delivering improved network performance monitoring and faster issue resolution across their infrastructure management teams.
-
I really liked their customized design services. I got my desired template made by their expert team. Thank You!
-
I am glad to have come across Slideteam. I was searching for some unique presentations and templates for my business. There are a lot of alternatives available here.