

Business performance dashboards with revenue and ratios





Try Before you Buy Download Free Sample Product
 Impress Your
Audience
 100%
Editable
 Save Hours
of Time


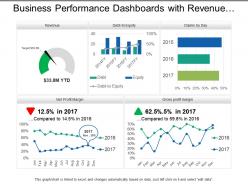
Examine the complexities with our business performance dashboards with revenue and ratios PPT deck. Understand fully what key factors set leading groups apart, develop internal processes and improve internal efficiency to adapting the business design. Following PPT design shows performance and working of your financial plan during your project launch. Various graphs and line charts are shown here in engaging colors and an appealing layout to reflect on your concerns. Use this PPT template to know the best for your company. Mention key points and reach your vision. It has become vital to catch the user's interest through advanced plans, keeping the same in mind our designers have produced this PPT template. Increase the degree of intimacy with our Business Performance Dashboards With Revenue And Ratios. Get folks interacting closely.
People who downloaded this PowerPoint presentation also viewed the following :
Business performance dashboards with revenue and ratios with all 6 slides:
Get folks to be accepting of different beliefs with our Business Performance Dashboards With Revenue And Ratios. It will discourage intolerance.


FAQs for Business performance dashboards with
Focus on the stuff that actually matters for your business - revenue, profit margins, customer acquisition cost, cash flow. Those are non-negotiable. Pipeline metrics and retention rates matter too, obviously. Honestly, I see so many people get caught up tracking follower counts and other fluff that doesn't move the needle. Your dashboard needs to answer two questions: how's business going and what's broken? Keep it simple - maybe 6-8 metrics tops. Any more than that and you'll just confuse yourself. Start with the basics I mentioned, then add whatever specific stuff drives real decisions for your particular situation.
Dude, visual dashboards are a game changer compared to drowning in spreadsheet data. Heat maps let you spot weird outliers right away. Trend lines show you what's actually happening over time. I'm obsessed with color coding lately - red flags catch your eye so much faster than scanning numbers. Bar charts are solid for hitting targets vs where you actually landed. The trick is figuring out which metrics really matter for decisions first. Then just mess around with different chart types until something clicks. Trust me, once you find the right visual, the patterns become super obvious.
Honestly, your KPIs should drive everything about your dashboard design. Pick your 5-7 most critical metrics first - the ones that actually impact decisions people make every day. Then build around those instead of shoving every possible number onto one screen. Ask your stakeholders what they need to decide on daily, then work backwards from there. I've watched so many teams create these monster dashboards that nobody uses because they're just overwhelming. Short version: focus on metrics that tie directly to business goals, and make the visualizations dead simple to read. Trends and issues should jump out immediately.
Honestly? Daily updates work for most dashboards. Real-time is cool for stuff like sales numbers or web traffic, but weekly/monthly is totally fine for bigger picture metrics. I've watched teams obsess over dashboards that refresh every few minutes when literally no one checks them more than once a day lol. Match your refresh to how fast things actually change in your business. Also think about when your team genuinely needs fresh data to make calls. Start daily and tweak from there - you'll figure out what works pretty quick.
Honestly, just figure out what data you're actually working with first and what your team needs to see. Integration is huge - you don't want to be stuck manually uploading stuff constantly (been there, it sucks). Tableau's amazing but kind of a pain to learn if your team isn't super technical. Google Data Studio might be better for that. Oh, and definitely think about mobile access since everyone checks dashboards on their phone now. Try the free trials obviously. Budget for training too because even simple tools need some ramp-up time. Pick whatever your team will genuinely use daily, not what looks coolest in demos.
So basically user roles control who sees what data and how they can mess with your dashboard. Map out your user groups first - trust me on this one. Executives want those big picture KPIs, but department managers need to dig into their team's specific numbers. Some people just need to look at stuff, others want to export everything under the sun. Honestly it gets pretty complex once you have like 5+ different user types. Interview your main groups about what they actually need before you build anything, or you'll be rebuilding the whole thing later.
Honestly, the worst thing you can do is cram like 20 different metrics on one screen - nobody wants to play Where's Waldo with their data. Skip the fancy charts if they don't actually help people find stuff quickly. Your dashboard should answer real business questions, not just show off whatever's easiest to track. Numbers mean nothing without context or benchmarks to compare against. I'd start with maybe 5-7 metrics that actually tie to your goals. You can always add more later once people get used to it.
Honestly, real-time data makes such a huge difference - your dashboard becomes way more useful than those boring static reports. You'll catch problems right when they happen instead of finding out days later (which is the worst). Customer behavior shifts? You'll see it. Sales dropping? You know immediately. It's like having a pulse on everything that matters in your business. Oh, and start with whatever metrics change the most throughout your day - those are the ones worth setting up first. Trust me, once you have live data flowing in, you won't want to go back to checking yesterday's numbers.
Yeah, dashboard design totally makes or breaks whether people actually use the thing. I've watched beautiful dashboards just sit there unused while these janky-looking ones get opened every single day. People will literally go back to Excel if your dashboard takes forever to load or they can't find basic info without clicking around everywhere. Put your most critical stuff right upfront. Clean layout, fast speeds - that's what matters. The best ones? You don't even think about the design, you just find what you need. Oh, and ask your users what they check first thing Monday morning, then build around that. Way more useful than guessing.
Honestly, just figure out what each team actually cares about day-to-day. Sales wants their pipeline stuff and conversion rates. HR needs headcount and turnover metrics - that kind of thing. Marketing's all about campaigns and leads. But here's what I'd do: grab coffee with someone from each department first. Ask them what decisions they're making and what data would actually help (not what sounds cool). Then build the dashboards around that. I learned this the hard way - nobody uses dashboards that look pretty but don't solve real problems. Start small with the teams that seem most interested.
Honestly, you'll want to nail down three main things. Start with validating your data sources - make sure they're actually reliable because garbage in, garbage out is painfully real. Set up automated alerts for weird spikes or missing data so you catch problems fast. Data lineage tracking is huge too, helps you trace where everything comes from when things go sideways. Monthly spot checks are your friend, especially after updates. I'd say document what you've got first, then build a review process around it. The automation stuff saves you from manually babysitting everything constantly.
Your dashboards will hit way harder if you treat them like telling a story. Start with the problem or context - nobody cares about random charts floating around. Then walk through what the data's actually showing. I swear, half the presentations I see just dump metrics everywhere and wonder why people zone out. Use phrases like "this caused" or "because of that" to connect your points. Build up to the big insights instead of leading with them. Wrap up with what it all means and what to do next. Trust me, the narrative approach works so much better.
Honestly, the easiest way is tracking time savings - like how long your team used to spend pulling data manually vs now. That's usually where you'll see the biggest difference. Also look at response times to problems and whether you're spotting issues faster than before. The whole "better decisions" thing is harder to measure, but track stuff like revenue growth or cost cuts after you launched it. Oh, and don't forget to subtract what the dashboard actually costs you! I'd set some baseline numbers before going live, then check again in 3-6 months. That should give you a pretty clear picture of whether it's worth it.
Honestly, AI-powered insights are where it's at right now - dashboards that actually predict stuff instead of just showing you what already happened. Self-service analytics is getting big too, so your team can build their own reports without constantly bothering IT (thank god). Mobile design is pretty much expected now. Oh, and natural language queries are actually decent - you can ask "why did sales tank last week?" and get real answers. Embedded analytics let you drop widgets right into your existing tools. Just don't get stuck with some rigid platform that won't grow with you.
Dude, just ask your users what they actually think. I've watched so many beautiful dashboards collect digital dust because nobody bothered checking if they were useful. Monthly check-ins work great - people will tell you which metrics matter and which ones are total junk. They'll also catch when your data's wonky before it becomes a disaster. The stuff you think they need? Probably wrong half the time. Listen to their complaints about what's confusing or missing. Honestly beats guessing what features to build next. You want something people will actually open every day, not just admire once.
No Reviews