


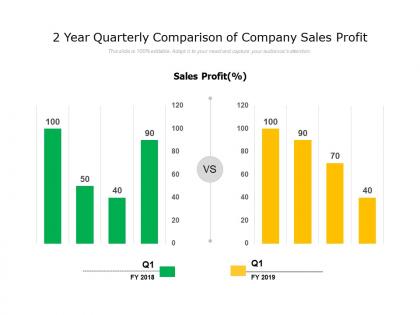
2 year quarterly comparison of company sales profit




Try Before you Buy Download Free Sample Product
 Impress Your
 Audience
 100%
100% Editable
 Save Hours
 of Time


Advance their careers with our 2 Year Quarterly Comparison Of Company Sales Profit. Your guidance will be beneficial.
People who downloaded this PowerPoint presentation also viewed the following :
2 year quarterly comparison of company sales profit with all 6 slides:
Be the guiding factor with our 2 Year Quarterly Comparison Of Company Sales Profit. They will benefit from your advice.



FAQs for 2 year quarterly comparison of
Look at gross profit margin and net profit per unit first - that's your bread and butter data right there. Revenue contribution matters too because honestly, sometimes a lower-margin product can carry your whole business if the volume's high enough. Don't forget inventory turnover rates either. Customer acquisition costs help if you've got that info handy. I'd start with your top 5-10 products and crunch these numbers. You'll spot the winners pretty fast. Net profit's better than gross since it factors in overhead, but both tell you different parts of the story.
Dude, seasonal trends will totally mess with your profit comparisons if you're not smart about it. Don't compare Q4 holiday sales to Q1 - that's just setting yourself up for confusion. You want same periods year-over-year instead, like Q4 2023 vs Q4 2024. Makes way more sense. Or grab seasonally adjusted data that evens out the predictable swings. I mean, a winter coat business will always crush it in December and look pathetic in July, right? Figure out your baseline seasonal patterns first. Then you can actually tell if you're beating expectations or just riding the usual wave.
Honestly, pricing is what makes or breaks most businesses. Price too low and you're basically giving away free money - doesn't matter if you're crushing sales numbers. Go too high and sure, your margins look pretty but nobody's buying. It's this weird juggling act that honestly stresses me out just thinking about it. Your competitors are all over the place with their strategies - some go cheap to grab market share, others position themselves as premium. The trick is hitting that sweet spot where you're not sacrificing volume for margin or vice versa.
So here's the thing - segmentation helps you figure out who'll actually pay more for what you're selling. Like, luxury phone buyers vs budget shoppers are completely different animals, right? You can charge way more to the premium crowd. Plus you'll discover these weird little niches where nobody's really competing yet, which is honestly where the money is. The trick is matching your product features to what each group actually cares about. Then price it based on how much value they see in it. Way better than trying to please everyone at once.
Excel or Google Sheets are perfect starting points - pivot tables still do most of the heavy lifting tbh. Once you outgrow those, Tableau and Power BI make killer dashboards that actually make sense to management. Your CRM (Salesforce, HubSpot) can automate data pulls which is a lifesaver. QuickBooks works well for the cost tracking side. Honestly, I'd just start with whatever you already have access to. No point buying fancy software until you know exactly what you need. Most teams overthink this stuff when spreadsheets handle 80% of what you're trying to do anyway.
COGS will totally mess with your profit margins - it can make sales look amazing or terrible depending on what's happening with costs. You really need to track both revenue AND cost changes when you're analyzing performance. Like, a product could have killer revenue growth but if your supplier jacked up prices, your actual profit might suck. That's been happening to everyone lately with how crazy supply costs have been. Break down your analysis so you can see what's actually revenue performance vs. what's just cost fluctuations eating into margins. Otherwise you'll think you're killing it when you're actually not.
Yeah, operating expenses mess with profit comparisons big time. First thing - break yours down by category and see where you actually stand against industry averages. Don't just look at the totals though. Some companies have crazy high rent or blow tons on marketing, which tanks their margins on paper. Your business model probably explains some differences too. Like maybe you're heavy on R&D while competitors just outsource everything (honestly that might be smart long-term). The real question is whether your expense structure is strategic or just... wasteful. Once you see the breakdown, then decide if changes actually make sense.
Yeah, customer acquisition costs are such a pain for profit comparisons. They hit products super unevenly - like if one product had massive ad spend while another grew organically, the first one looks terrible profit-wise even if it's crushing it long-term. The timing thing screws you over too. You dump money upfront on acquisition but revenue comes in slowly over months. Makes any short-term analysis basically useless, honestly. Best bet is either adjusting for the acquisition spend differences or just waiting longer to see real performance. I learned this the hard way with our Q3 numbers last year.
Honestly, bar charts are probably your best bet for comparing profits between products or time periods. Line graphs work well too if you want to track trends. I used to love pie charts but they're kinda played out now - everyone uses them for everything. Heat maps are actually pretty cool for spotting patterns when you've got multiple variables like different regions and quarters. You could also build a dashboard that combines a few chart types, gives you everything in one view. Start with whatever your team's already using though. Excel's fine for basic stuff before you go buying expensive software.
So competitive analysis is basically your reality check for figuring out profit gaps. Look at 3-5 competitors and compare their pricing to yours - you might be leaving money on the table or pricing yourself out. Then try to reverse-engineer their margins and costs. Honestly, it's kind of like stalking your competition but in a productive way lol. You'll quickly see if your costs are bloated or if they're just positioning better than you. Sometimes the gap isn't pricing at all - could be they're way more efficient operationally. Start with their public pricing and work backwards from there.
Dude, I'd hit three things hard: pricing, costs, and what you're actually selling. Check if you can bump prices first - seriously, half the time stuff just isn't priced right. Then dig into supplier costs, maybe renegotiate or find cheaper alternatives. The product mix thing is massive though. You might be pushing crap margins when better options exist in the same space. Pricing's usually your fastest fix if customers can stomach it. I'd peek at competitor prices real quick, then test small increases on a few products. See how people react before going all-in.
Bundling usually makes you more money than selling stuff separately. Here's the thing - customers think they're getting a deal even when you're charging more overall. It's weird psychology but it works. You can also get rid of products that don't sell well by throwing them in with your bestsellers. Average order value goes up too, which is obviously good for profits. Just make sure the bundle price doesn't seem crazy expensive. I'd start by figuring out what products actually go together, then maybe test a few different combos to see what hits.
Dude, loyal customers are everything for long-term profits. They're way cheaper to keep than finding new ones - like, a 5% bump in retention can increase profits by 25-95% which is honestly insane when you think about it. Repeat buyers spend more and aren't as picky about prices, so they're basically your safety net when things get rough. Your acquisition costs drop big time too. I always tell people to track retention rates next to profit numbers because that's where you see the real picture. New customers matter, but honestly? Your existing ones are probably more valuable than you realize.
So you need to adjust those old profit numbers for inflation - basically convert everything to today's dollars. Grab an inflation calculator online or use the Consumer Price Index. That way you're comparing apples to apples instead of getting fooled by the raw numbers. Like that $100k you made in 2020? That's actually worth around $115k now, which is kinda wild when you think about it. Pick your base year (probably just use 2024) and convert all your historical data to match. Otherwise you'll think you're doing worse than you actually are, or vice versa.
Hey! Don't cherry-pick timeframes or hide costs to make your numbers look better - I've literally watched people "forget" to mention their worst quarter lol. Be upfront about your data sources and methods. Include context like market conditions that might mess with the results. Compare apples to apples across regions or products. If you're making assumptions or have sketchy data, just say so upfront. People will actually trust you more when you acknowledge the full picture instead of trying to spin everything. Let the data tell its real story, not some fantasy version.
No Reviews