

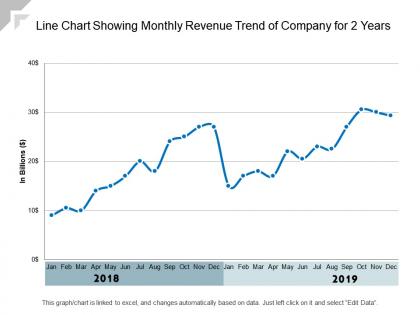
Line chart showing monthly revenue trend of company for 2 years




Try Before you Buy Download Free Sample Product
 Impress Your
Audience
 100%
Editable
 Save Hours
of Time


Give a composite account with our Line Chart Showing Monthly Revenue Trend Of Company For 2 Years. Ensure your coverage includes every important input.
People who downloaded this PowerPoint presentation also viewed the following :
Line chart showing monthly revenue trend of company for 2 years with all 6 slides:
Ensure your coverage includes every important input with our Line Chart Showing Monthly Revenue Trend Of Company For 2 Years. Be able to give a composite account.




FAQs for Line chart showing monthly revenue trend of company
Track your month-over-month growth and year-over-year numbers first - the YoY helps with seasonal stuff. Revenue per customer matters too. I'm obsessed with the new vs recurring revenue split because it basically tells you if your business is actually healthy or just looks good on paper. Customer acquisition trends are critical since they predict your future months. Oh, and definitely watch churn rates. You might think you're killing it with growth but actually bleeding customers like crazy. Build a simple dashboard for all this - way easier to catch patterns when everything's in one place.
Oh man, seasonal stuff will mess with your head if you don't watch out. Like I freaked out last summer thinking our numbers were tanking - turns out it was just normal seasonal dip. Don't compare January to December, that's apples to oranges. Year-over-year is way better, or compare within the same seasons. Actually, try those 12-month rolling averages too, they smooth out all the weird spikes and dips. Trust me, once you start factoring in those patterns everything makes so much more sense.
Honestly, if you already have Tableau or Power BI, just use those - they're great for this stuff. Google Sheets works fine too if you're not dealing with massive amounts of data (though it gets annoying fast with big datasets). I'd skip the manual export headache and connect your CRM straight to whatever tool you pick. That way everything updates itself. Excel's decent but... eh, kinda clunky for dashboards. The real trick is finding something your team will actually open regularly. Doesn't matter how powerful it is if it just sits there collecting digital dust.
Oh man, segmentation is a game changer for revenue analysis. So like, your enterprise customers probably spike every quarter while smaller ones are all over the place with seasons and random events. Most companies mess this up because they just stare at the big total number - which honestly tells you nothing useful. Break it down by your main 2-3 customer types instead. Each group has their own weird patterns, and you'll catch trends way earlier this way. I've seen teams finally "get it" once they stop lumping everyone together.
Honestly, pricing changes mess with your revenue more than almost anything else. Bump prices up? You'll see quick cash boosts but fewer new customers signing up. Drop them and suddenly everyone wants in, but your profit margins get squeezed hard. I learned that one the expensive way! All those seasonal deals and competitor price wars create wild month-to-month swings too. Here's the thing though - customers don't react instantly. Give it like 30-60 days before you really know if a pricing change worked or totally backfired.
Look, you need at least a year or two of data to see what's actually happening with your revenue. Plot it out on a basic chart first - way easier to spot the obvious stuff before you dive into complicated forecasting. Seasonality jumps out pretty quick, plus you'll see growth trends and those annoying cyclical drops. Without this context you're just throwing darts blindfolded, honestly. The patterns show you what actually moves your numbers so you can build something that makes sense. Oh and definitely go back 12-24 months if you can - captures the full seasonal picture.
Look, those month-to-month swings? Total noise most of the time. I learned this the hard way when I freaked out over a random February dip last year. What you really want is at least 3-6 months of data to spot actual trends. Seasonal stuff will mess with your head too - January always sucks for most businesses. Try comparing this January to last January instead. Also factor in your marketing pushes, holidays, whatever. Honestly, just set up a rolling 3-month average and save yourself the headache. Way easier to see what's actually happening.
Honestly, just follow your money patterns. Pull up 2-3 years of monthly revenue data and you'll see the trends clear as day. Q4 spike? Summer dead zone? Plan around that stuff. I'd launch big campaigns right before your usual peak months to ride that wave. During slow periods, you can try counter-seasonal campaigns but man, fighting seasonality is brutal - sometimes it's better to just lean into the natural flow. Match your budget intensity to when people actually want to buy. It's way easier than trying to force sales when nobody's in buying mode.
Dude, start with the big ones - interest rates, inflation, unemployment, and consumer spending. GDP's useful but it's always behind the curve, you know? Also grab whatever's specific to your industry. Like if you're in construction, housing starts matter way more than some random metric. Fed's economic calendar is gold - check it monthly. Oh and set up Google alerts so this stuff just comes to you. Currency stuff will screw you over if you're dealing internationally. Trust me, catching these trends early beats scrambling later.
Look at your monthly revenue like a cheat sheet for what's coming next. See those Q4 spikes every year? Order your inventory in August/September, not October when it's too late. I learned this the hard way once - February is brutal if you're sitting on tons of leftover stock. You need at least 2-3 years of data though, because one weird month doesn't mean anything. Map out where your sales peak and compare that to when you're actually placing orders. Trust me, you'll spot the gaps pretty quick and can adjust from there.
Look, your retention rate basically controls how steady your revenue is. Keep more customers around? Money comes in predictably. Lose them constantly and you'll get those awful up-and-down months that make you question everything. Here's the thing - customers who stick around usually end up spending more through add-ons and stuff. Really helps when new sales are slow. I always tell people to watch both numbers together because when retention starts tanking, your revenue's gonna get bumpy in like 1-2 months. The pattern's pretty reliable, honestly.
Look, when your competitors drop new stuff or slash prices, your monthly revenue usually takes a hit. Sometimes it's pretty rough tbh. Works the other way too though - if they mess up or you beat them to market, your numbers climb. Here's the thing that always catches people off guard: there's usually a 1-2 month delay before you see the impact. So don't freak out right when they announce something big. I'd start tracking their major moves and see how they line up with your revenue patterns. You'll start noticing the connections pretty quick.
Okay so first thing - dive into your numbers and figure out what's actually happening. Are you losing customers? Spending less per order? Could just be seasonal weirdness too, honestly. If it's an acquisition problem, maybe boost your marketing or check if you're targeting the right people. Customer retention tanking? Work on the experience or try some win-back emails. Sometimes though - and I've seen this before - it's literally just a random dip and you're stressing for nothing. But yeah, definitely start doing weekly check-ins on revenue so you'll spot this stuff early next time.
Honestly, the magic happens when your sales, marketing, and product teams actually start talking to each other weekly. Have them review pipeline stuff, customer feedback, all that good data together. Marketing can pivot campaigns based on what sales is hearing from prospects. Product can focus on features that'll actually close deals. Sounds obvious but you'd be shocked how many companies still work in silos. Get everyone looking at the same revenue dashboard - that's huge. Then they can call each other out when targets slip. I'd start with bi-weekly check-ins and see how it goes.
Honestly, the real insights come from digging into the *why* behind those revenue swings. Look at what actually happened during your high and low months - new product drops, pricing tweaks, marketing pushes, even random stuff like supply chain issues. Seasonal patterns are huge too. I swear, sometimes it's the weirdest things that move numbers - like a competitor's bad press or holiday timing. Customer feedback from those periods tells you way more than spreadsheets ever will. Make a list of major events for each month and see what connects.
No Reviews