

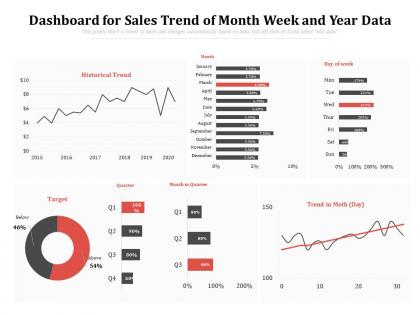
Dashboard Snapshot for sales trend of month week and year data




Try Before you Buy Download Free Sample Product
 Impress Your
 Audience
 100%
100% Editable
 Save Hours
 of Time


Our Dashboard For Sales Trend Of Month Week And Year Data are topically designed to provide an attractive backdrop to any subject. Use them to look like a presentation pro.
People who downloaded this PowerPoint presentation also viewed the following :
Dashboard Snapshot for sales trend of month week and year data with all 2 slides:
Use our Dashboard Snapshot For Sales Trend Of Month Week And Year Data to effectively help you save your valuable time. They are readymade to fit into any presentation structure.
FAQs for Dashboard Snapshot for sales trend of month week
Start with the obvious stuff - total sales, conversion rates, how each rep's doing. Pipeline metrics matter too: lead volume, deal size, cycle length. Activity tracking is where most people mess up though - calls, emails, meetings booked. That's your "why" when numbers look weird. Win/loss ratios and quota numbers are pretty standard. Oh, and customer acquisition cost - seriously underrated metric. Don't go overboard with like 20 different KPIs or you'll never actually use any of them. These basics will show you what's working and what isn't.
Honestly, charts and graphs are game-changers for sales data. You'll spot trends instantly instead of getting lost in endless spreadsheet rows. Bar charts make it super easy to compare different regions or months. Line graphs? Perfect for seeing if you're actually growing or just think you are. Heat maps are probably my favorite though - they show your winners and losers right away. I'd start simple with basic charts first. Your team needs time to get used to reading them before you throw complex stuff at them. Way better than staring at numbers all day!
Put your biggest numbers right up top - revenue, conversions, your hottest deals. That's what you check first anyway, right? I like grouping similar stuff together, so all your pipeline data lives in one spot. Use the same colors throughout so you're not constantly trying to decode what everything means. Don't cram everything together either - white space actually makes things way easier to scan. Save the detailed breakdowns for when you click through; your main dashboard should be clean. Oh, and arrange it all in whatever order you naturally go through during your morning check-ins.
Daily updates are your sweet spot, but real-time is even better if you can swing it. Weekly? Way too slow - you'll miss stuff. Honestly, I learned this the hard way when we were running this campaign last year and kept missing obvious trends. Fast-moving sales or tight campaigns definitely need real-time data. Check what your CRM can actually do first, then just automate the whole thing so it refreshes itself. Most teams don't need minute-by-minute anyway since you're tracking bigger patterns. Set it and forget it.
Honestly, I'd go straight to the big three: Tableau, Power BI, or Looker Studio. Power BI makes the most sense if you're already using Microsoft stuff - connects super easily with Excel and all that. Tableau costs more but damn, the interface is smooth. Looker Studio's free so that's hard to beat when you're just starting out. Oh, and advanced Excel with pivot tables can work too if you're scrappy about it. Main thing is picking something that hooks directly into your CRM. Trust me, you don't want to be updating numbers manually every single week.
Just ask each team what they actually check every day - that's your starting point. Sales reps need their pipeline and quota stuff front and center. Managers want the team overview and forecasting numbers. VPs? They're looking at big picture revenue trends, not getting into the weeds of every deal (thank god, because that would be overwhelming). Most tools let you set up different views based on roles automatically. Honestly, the hardest part is usually getting people to actually tell you what they need instead of just saying "everything." Build around what they'll really use.
Focus on three things: data validation, regular audits, and tracking your sources. Automated checks are a lifesaver for catching dumb errors like negative quantities or dates from 1999 - seriously, this stuff happens all the time. Pull everything from one place, preferably your CRM. Monthly audits where someone spot-checks transactions manually will save your butt later. Set up reconciliation processes to compare dashboard numbers against actual reports. Oh, and document where each metric comes from! When numbers look funky (and they will), you can trace back quickly instead of panicking.
Grab about 12-18 months of sales data - that's your sweet spot for seeing real patterns. Hook it up to your CRM so everything updates automatically. Monthly numbers are kinda noisy, so I'd stick with year-over-year stuff and rolling averages instead. Way more reliable. Set up trend lines for revenue, conversion rates, pipeline velocity - you know, the metrics that actually matter. Here's the thing though: seasonal patterns are gold when you find them. Start with quarterly views first, then you can always zoom in later. Oh and make sure you're tracking what strategies actually worked - that's where the real insights are hiding.
Honestly, you *have* to get feedback from your users or you're just guessing. Your sales team knows if those charts you spent forever on are actually helpful or just eye candy. I've watched people build these gorgeous dashboards that nobody uses because they never asked what the team actually needed. Regular check-ins make such a difference - could be surveys, quick chats, whatever works. They'll tell you what's confusing and what features matter most. Plus you'll catch problems before they become real headaches. Trust me, it saves so much time in the long run.
Oh dude, you need a sales dashboard for sure. It shows everything happening with your team right now - who's crushing it, who needs help, which products are selling like crazy. Way better than drowning in Excel hell, trust me. Just make sure all your important stuff is there: revenue, conversion rates, forecasts, whatever matters most. I'd set up alerts for the big metrics too. That way when something goes sideways (and it will), you'll know immediately instead of finding out weeks later. Game changer honestly.
Honestly, the worst thing you can do is throw everything onto one screen - it just becomes visual chaos. Skip the vanity metrics too. Like, conversion rates sound sexy but they don't actually tell you what to fix, you know? Always show trends instead of just today's numbers. Context matters - add your targets or benchmarks so people know if 47% is good or terrible. Oh, and start small! Pick maybe 5-7 metrics that actually matter to your team. You can always add more later once you see what they're actually looking at.
Dude, mobile access is huge for remote sales teams. Your reps can check pipeline updates from literally anywhere instead of being stuck at their desks. During client meetings? They've got all the data right there. Deal status changes? Updated instantly. The push notifications alone are worth it – keeps everyone in the loop when hot leads come in. Just make sure it actually works well on phones (you'd be surprised how many don't) and has some offline features because cell service can be trash sometimes. Honestly changed everything for our team.
Honestly, real-time data is a total game changer for sales monitoring. Instead of staring at yesterday's stale numbers, you're seeing what's actually happening right now. Deals stalling? You'll know immediately, not next Tuesday. Problems get caught before they blow up. Hot opportunities don't slip through the cracks while you're waiting for weekly reports. The best part is being able to coach reps on live deals and move resources around when they're actually needed. Though you don't need everything tracked real-time - figure out what needs instant updates versus what can wait for daily check-ins.
Dude, get a sales dashboard if you don't have one already. The real-time view of your pipeline is a game changer for forecasting - way better than those messy spreadsheets we all hate. You'll start noticing patterns in win rates and how fast deals actually close. Historical data doesn't lie, unlike our overly optimistic projections lol. Visual tracking beats digging through boring reports every time. I'd say focus on conversion rates by source first - that's where you'll find the most honest baseline for setting next quarter's targets. Makes goal-setting feel less like throwing darts blindfolded.
Start with your CRM - that's where all your sales gold lives. Salesforce, HubSpot, whatever you're using. Marketing automation comes next so you can actually see which campaigns work. Then hit your ERP for inventory and pricing stuff. Honestly, people sleep on email and calendar integrations but those activity metrics are huge for figuring out what your team's actually doing. Accounting software's worth connecting too since it shows real revenue vs what you thought you'd make. Don't try to hook up everything day one though - you'll go crazy. Pick the big ones first.
No Reviews